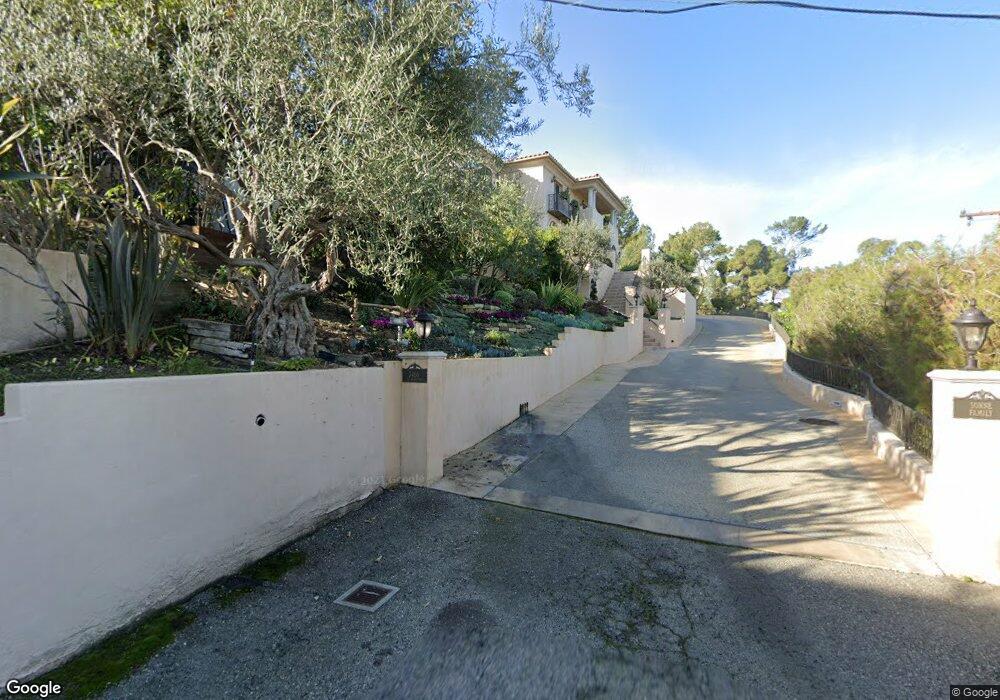
3466 Via Campesina Rancho Palos Verdes, CA 90275
Estimated Value: $3,060,000 - $6,164,000
5
Beds
6
Baths
5,036
Sq Ft
$966/Sq Ft
Est. Value
About This Home
This home is located at 3466 Via Campesina, Rancho Palos Verdes, CA 90275 and is currently estimated at $4,864,707, approximately $965 per square foot. 3466 Via Campesina is a home located in Los Angeles County with nearby schools including Rancho Vista Elementary School, Palos Verdes Intermediate School, and Palos Verdes Peninsula High School.
Ownership History
Date
Name
Owned For
Owner Type
Purchase Details
Closed on
Jun 14, 2024
Sold by
Brown Kia J
Bought by
Brown Family Trust and Brown
Current Estimated Value
Purchase Details
Closed on
Jun 1, 2024
Sold by
Brown Kia J
Bought by
Brown Family Trust and Brown
Purchase Details
Closed on
Dec 19, 2023
Sold by
Sonne Kye C
Bought by
Brown Kia J
Purchase Details
Closed on
Dec 12, 2023
Sold by
Marc Sonne And Barbara Sonne Family Trus
Bought by
Sonne Kye C and Brown Kia J
Purchase Details
Closed on
Apr 24, 2015
Sold by
Sonne Marc W
Bought by
Marc Sonne & Barbara Sonne Family Trust
Purchase Details
Closed on
Jan 14, 2000
Sold by
Chuang Sheng Cheng Chen and Chuang Hsiu Hsin Hele
Bought by
Sonne Marc W
Home Financials for this Owner
Home Financials are based on the most recent Mortgage that was taken out on this home.
Original Mortgage
$505,000
Interest Rate
8.27%
Mortgage Type
Balloon
Create a Home Valuation Report for This Property
The Home Valuation Report is an in-depth analysis detailing your home's value as well as a comparison with similar homes in the area
Home Values in the Area
Average Home Value in this Area
Purchase History
| Date | Buyer | Sale Price | Title Company |
|---|---|---|---|
| Brown Family Trust | -- | None Listed On Document | |
| Brown Family Trust | -- | None Listed On Document | |
| Brown Kia J | $916,000 | Old Republic Title Company | |
| Sonne Kye C | -- | None Listed On Document | |
| Marc Sonne & Barbara Sonne Family Trust | -- | None Available | |
| Sonne Marc W | $700,000 | Equity Title |
Source: Public Records
Mortgage History
| Date | Status | Borrower | Loan Amount |
|---|---|---|---|
| Previous Owner | Sonne Marc W | $505,000 |
Source: Public Records
Tax History Compared to Growth
Tax History
| Year | Tax Paid | Tax Assessment Tax Assessment Total Assessment is a certain percentage of the fair market value that is determined by local assessors to be the total taxable value of land and additions on the property. | Land | Improvement |
|---|---|---|---|---|
| 2025 | $48,320 | $3,698,161 | $1,983,137 | $1,715,024 |
| 2024 | $48,320 | $4,335,000 | $1,938,000 | $2,397,000 |
| 2023 | $27,938 | $2,445,684 | $1,034,103 | $1,411,581 |
| 2022 | $26,520 | $2,397,730 | $1,013,827 | $1,383,903 |
| 2021 | $26,499 | $2,350,717 | $993,949 | $1,356,768 |
| 2019 | $25,337 | $2,280,996 | $964,469 | $1,316,527 |
| 2018 | $25,037 | $2,236,271 | $945,558 | $1,290,713 |
| 2016 | $23,722 | $2,149,436 | $908,842 | $1,240,594 |
| 2015 | $23,489 | $2,117,151 | $895,191 | $1,221,960 |
| 2014 | $23,171 | $2,075,680 | $877,656 | $1,198,024 |
Source: Public Records
Map
Nearby Homes
- 26228 Birchfield Ave
- 5 Yellow Brick Rd
- 26326 Birchfield Ave
- 5508 Ironwood St
- 702 Via la Cuesta
- 4060 Via Opata
- 3609 Palos Verdes Dr N
- 6039 Via Sonoma
- 6045 Montemalaga Dr
- 4548 Marloma Dr
- 3321 Via la Selva
- 121 Via Ardilla
- 3901 Via Cardelina
- 2521 Novato Place
- 2708 Via Elevado
- 875 Calle de Arboles
- 728 Calle de Arboles
- 4600 Paseo de Las Tortugas
- 1300 Granvia Altamira
- 16 Silver Saddle Ln
- 5383 Rollingridge Rd
- 3450 Via Campesina
- 3340 Via Campesina
- 3462 Via Campesina
- 3470 Via Campesina
- 3458 Via Campesina
- 5375 Rollingridge Rd
- 5357 Bayridge Rd
- 3440 Via Campesina
- 5351 Bayridge Rd
- 5405 Bayridge Rd
- 5345 Bayridge Rd
- 5507 Graylog St
- 5503 Graylog St
- 3400 Via Campesina
- 5337 Bayridge Rd
- 3456 Via Campesina
- 5411 Bayridge Rd
- 3330 Via Campesina
- 3420 Via Campesina