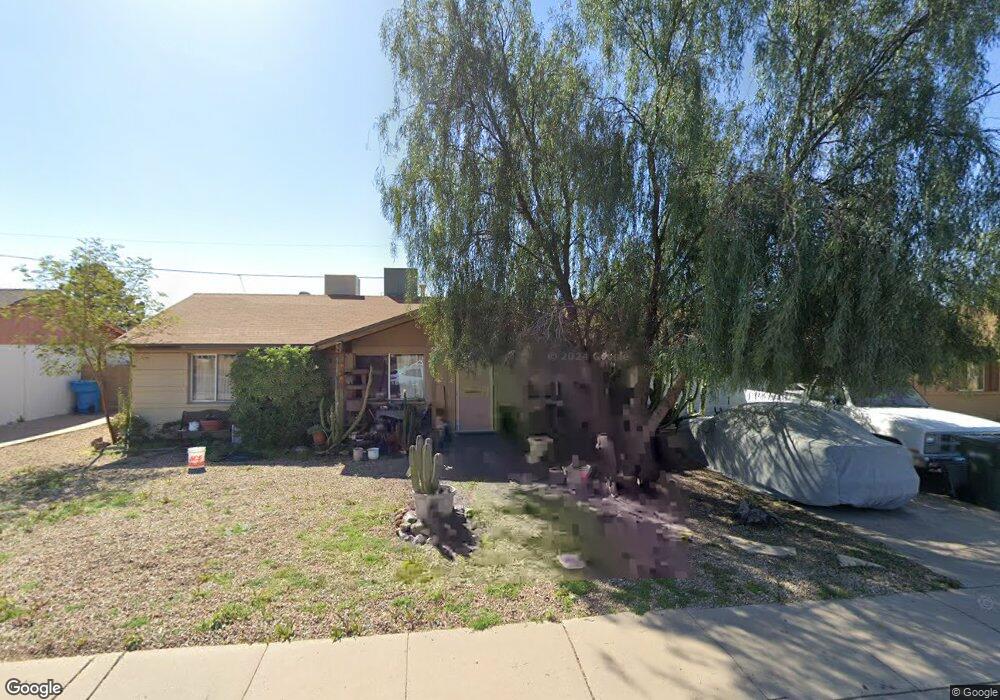
3469 E Thunderbird Rd Phoenix, AZ 85032
Paradise Valley Village NeighborhoodEstimated Value: $328,009 - $412,000
Studio
2
Baths
1,240
Sq Ft
$299/Sq Ft
Est. Value
About This Home
This home is located at 3469 E Thunderbird Rd, Phoenix, AZ 85032 and is currently estimated at $371,002, approximately $299 per square foot. 3469 E Thunderbird Rd is a home located in Maricopa County with nearby schools including Indian Bend Elementary School, Shea Middle School, and Shadow Mountain High School.
Ownership History
Date
Name
Owned For
Owner Type
Purchase Details
Closed on
Nov 19, 2003
Sold by
French H E and French Pansy L
Bought by
Horn Christel L
Current Estimated Value
Home Financials for this Owner
Home Financials are based on the most recent Mortgage that was taken out on this home.
Original Mortgage
$118,146
Outstanding Balance
$54,354
Interest Rate
5.89%
Mortgage Type
FHA
Estimated Equity
$316,648
Purchase Details
Closed on
Jul 14, 2003
Sold by
Warner Edward V and Warner Sarah R
Bought by
French H E and French Pansy L
Purchase Details
Closed on
Jun 3, 1996
Sold by
Martin Mary
Bought by
Warner Edward and Warner Sarah R
Home Financials for this Owner
Home Financials are based on the most recent Mortgage that was taken out on this home.
Original Mortgage
$69,018
Interest Rate
7.96%
Mortgage Type
New Conventional
Purchase Details
Closed on
Mar 11, 1996
Sold by
Martin Arthur J
Bought by
Martin Mary
Create a Home Valuation Report for This Property
The Home Valuation Report is an in-depth analysis detailing your home's value as well as a comparison with similar homes in the area
Home Values in the Area
Average Home Value in this Area
Purchase History
| Date | Buyer | Sale Price | Title Company |
|---|---|---|---|
| Horn Christel L | $120,000 | Land Title Agency Of Az Inc | |
| French H E | $88,000 | Land Title Agency Of Az Inc | |
| Warner Edward | $75,000 | Security Title Agency | |
| Martin Mary | -- | -- |
Source: Public Records
Mortgage History
| Date | Status | Borrower | Loan Amount |
|---|---|---|---|
| Open | Horn Christel L | $118,146 | |
| Previous Owner | Warner Edward | $69,018 |
Source: Public Records
Tax History
| Year | Tax Paid | Tax Assessment Tax Assessment Total Assessment is a certain percentage of the fair market value that is determined by local assessors to be the total taxable value of land and additions on the property. | Land | Improvement |
|---|---|---|---|---|
| 2025 | $899 | $10,385 | -- | -- |
| 2024 | $856 | $9,891 | -- | -- |
| 2023 | $856 | $28,270 | $5,650 | $22,620 |
| 2022 | $848 | $21,230 | $4,240 | $16,990 |
| 2021 | $862 | $18,480 | $3,690 | $14,790 |
| 2020 | $833 | $17,630 | $3,520 | $14,110 |
| 2019 | $837 | $14,920 | $2,980 | $11,940 |
| 2018 | $806 | $13,030 | $2,600 | $10,430 |
| 2017 | $770 | $12,320 | $2,460 | $9,860 |
| 2016 | $758 | $11,760 | $2,350 | $9,410 |
| 2015 | $703 | $10,520 | $2,100 | $8,420 |
Source: Public Records
Map
Nearby Homes
- 3478 E Sharon Dr
- 3445 E Thunderbird Rd
- 3540 E Voltaire Dr
- 3474 E Delcoa Dr
- 3471 E Delcoa Dr
- 13629 N 36th St
- 3473 E Crocus Dr
- 3307 E Thunderbird Rd
- 13839 N 33rd St
- 3515 E Winchcomb Dr
- 3628 E Hearn Rd
- 3512 E Willow Ave
- 3234 E Friess Dr
- 13642 N 38th St
- 3302 E Andorra Dr Unit 2
- 3366 E Evans Dr
- 13822 N 38th Place
- 3826 E Eugie Ave
- 3508 E Acoma Dr
- 3436 E Acoma Dr
- 3463 E Thunderbird Rd
- 3473 E Thunderbird Rd
- 3468 E Sharon Dr
- 3472 E Sharon Dr
- 3462 E Sharon Dr
- 3457 E Thunderbird Rd
- 3479 E Thunderbird Rd
- 3458 E Sharon Dr
- 3451 E Thunderbird Rd
- 3456 E Thunderbird Rd
- 3460 E Thunderbird Rd
- 3450 E Thunderbird Rd
- 3452 E Sharon Dr
- 3466 E Thunderbird Rd
- 3465 E Sharon Dr
- 3471 E Sharon Dr
- 3446 E Thunderbird Rd
- 3461 E Sharon Dr
- 3475 E Sharon Dr
- 3501 E Thunderbird Rd
Your Personal Tour Guide
Ask me questions while you tour the home.