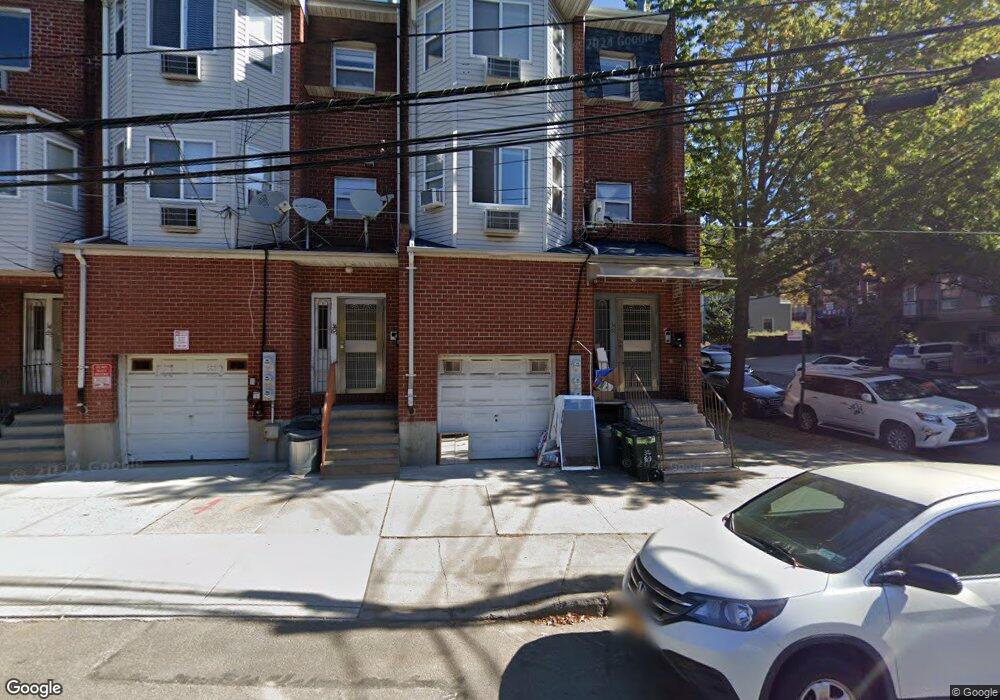
3469 Leavitt St Flushing, NY 11354
Flushing-Willets Point NeighborhoodEstimated Value: $1,708,000 - $2,100,136
Studio
--
Bath
3,500
Sq Ft
$539/Sq Ft
Est. Value
About This Home
This home is located at 3469 Leavitt St, Flushing, NY 11354 and is currently estimated at $1,886,379, approximately $538 per square foot. 3469 Leavitt St is a home located in Queens County with nearby schools including P.S. 214 Cadwallader Colden, Jhs 185 Edward Bleeker, and Flushing High School.
Ownership History
Date
Name
Owned For
Owner Type
Purchase Details
Closed on
Aug 22, 2002
Sold by
Chen Chien-Hua and Lin Lun Qiao
Bought by
Chen Chien-Hua
Current Estimated Value
Purchase Details
Closed on
Jun 21, 2000
Sold by
Tri Bassco Inc
Bought by
Lin Lun Qiao and Chen Chien Hua
Home Financials for this Owner
Home Financials are based on the most recent Mortgage that was taken out on this home.
Original Mortgage
$295,000
Interest Rate
7.89%
Purchase Details
Closed on
Sep 14, 1998
Sold by
Heavenly New York Lin Yin Temple Inc
Bought by
Tri Bassco Inc
Home Financials for this Owner
Home Financials are based on the most recent Mortgage that was taken out on this home.
Original Mortgage
$100,000
Interest Rate
9%
Mortgage Type
Seller Take Back
Purchase Details
Closed on
Jan 3, 1995
Sold by
Wang Howard T
Bought by
Heavenly New York Ling Yin Temple Inc
Create a Home Valuation Report for This Property
The Home Valuation Report is an in-depth analysis detailing your home's value as well as a comparison with similar homes in the area
Home Values in the Area
Average Home Value in this Area
Purchase History
| Date | Buyer | Sale Price | Title Company |
|---|---|---|---|
| Chen Chien-Hua | -- | -- | |
| Chen Chien-Hua | -- | -- | |
| Lin Lun Qiao | $471,500 | Lawyers Title Insurance Corp | |
| Lin Lun Qiao | $471,500 | Lawyers Title Insurance Corp | |
| Tri Bassco Inc | $215,000 | First American Title Ins Co | |
| Tri Bassco Inc | $215,000 | First American Title Ins Co | |
| Heavenly New York Ling Yin Temple Inc | $152,000 | -- | |
| Heavenly New York Ling Yin Temple Inc | $152,000 | -- |
Source: Public Records
Mortgage History
| Date | Status | Borrower | Loan Amount |
|---|---|---|---|
| Previous Owner | Lin Lun Qiao | $295,000 | |
| Previous Owner | Tri Bassco Inc | $100,000 |
Source: Public Records
Tax History
| Year | Tax Paid | Tax Assessment Tax Assessment Total Assessment is a certain percentage of the fair market value that is determined by local assessors to be the total taxable value of land and additions on the property. | Land | Improvement |
|---|---|---|---|---|
| 2025 | $13,550 | $68,861 | $5,910 | $62,951 |
| 2024 | $6,646 | $68,861 | $7,081 | $61,780 |
| 2023 | $13,446 | $68,344 | $5,979 | $62,365 |
| 2022 | $11,938 | $118,260 | $12,420 | $105,840 |
| 2021 | $12,505 | $107,460 | $12,420 | $95,040 |
| 2020 | $11,850 | $109,320 | $12,420 | $96,900 |
| 2019 | $11,711 | $98,400 | $12,420 | $85,980 |
| 2018 | $11,312 | $56,953 | $8,391 | $48,562 |
| 2017 | $10,653 | $53,730 | $9,782 | $43,948 |
| 2016 | $9,823 | $53,730 | $9,782 | $43,948 |
| 2015 | $6,841 | $47,820 | $11,220 | $36,600 |
| 2014 | $6,841 | $47,820 | $11,220 | $36,600 |
Source: Public Records
Map
Nearby Homes
- 138-10 35th Ave Unit 4A
- 138-10 35th Ave Unit 5
- 35-19 Leavitt St Unit 2I
- 35-32 Leavitt St Unit PH I
- 35-32 Leavitt St Unit PH E
- 35-32 Leavitt St Unit PH J
- 35-32 Leavitt St Unit PH G
- 35-32 Leavitt St Unit PH H
- 3506 Leavitt St
- 3506 Leavitt St Unit 3B
- 34-51 Leavitt St Unit 2B
- 35-06 Leavitt St Unit 7F
- 35-06 Leavitt St Unit 3
- 136-16 35th Ave Unit 2B
- 136-16 35th Ave Unit 7C
- 138-12 Northern Blvd Unit 3E
- 138-12 Northern Blvd Unit 6B
- 138-12 Northern Blvd Unit 6F
- 138-12 Northern Blvd Unit 3C
- 138-12 Northern Blvd Unit 7F
- 3467 Leavitt St
- 3465 Leavitt St
- 34-65 Leavitt St
- 34-65 Leavitt St Unit 2
- 34-65 Leavitt St Unit 3
- 35-1 Leavitt St
- 35-03 Leavitt St
- 35-03 Leavitt St Unit 1,2,3
- 13807 35th Ave
- 3463 Leavitt St
- 13807 35th Ave
- 3461 Leavitt St
- 34-61 Leavitt St
- 34-61 Leavitt St Unit 3rd.
- 35-17 Leavitt St Unit 5
- 35-17 Leavitt St
- 35-19 Leavitt St Unit 4H
- 35-19 Leavitt St
- 35-19 Leavitt St Unit 5 H
- 35-19 Leavitt St Unit Cf2
Your Personal Tour Guide
Ask me questions while you tour the home.