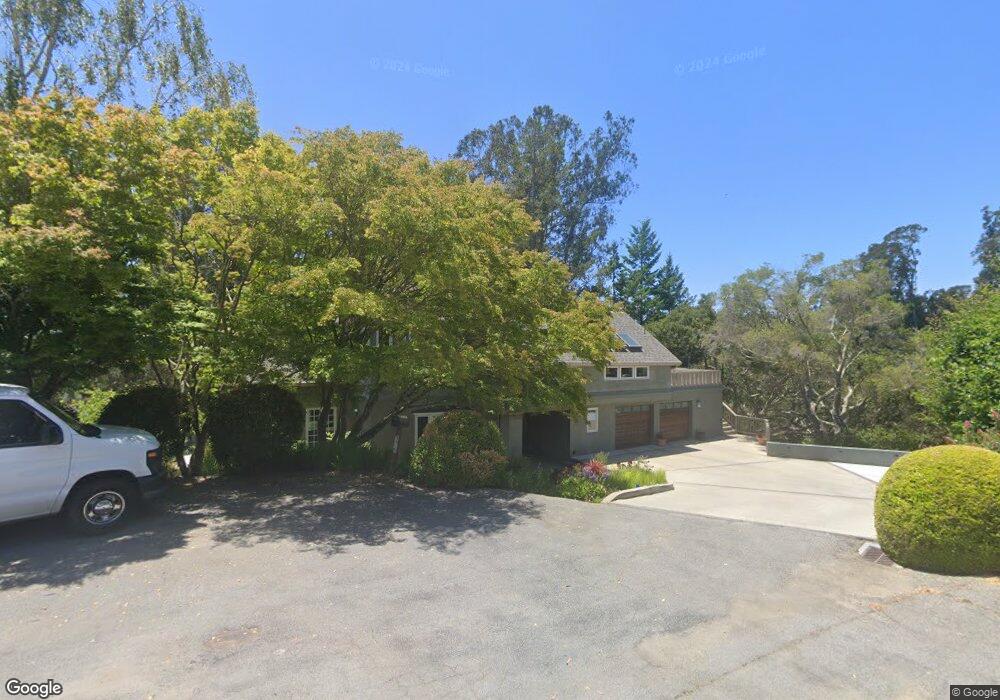
3469 Maplethorpe Ln Soquel, CA 95073
Estimated Value: $1,492,000 - $2,030,281
4
Beds
4
Baths
5,003
Sq Ft
$359/Sq Ft
Est. Value
About This Home
This home is located at 3469 Maplethorpe Ln, Soquel, CA 95073 and is currently estimated at $1,795,070, approximately $358 per square foot. 3469 Maplethorpe Ln is a home located in Santa Cruz County with nearby schools including Main Street Elementary School, New Brighton Middle School, and Mission Hill Middle School.
Ownership History
Date
Name
Owned For
Owner Type
Purchase Details
Closed on
Aug 19, 2021
Sold by
Miroyan Peter V
Bought by
Miroyan Peter Vartkes and The Peter Vartkes Revocable Tr
Current Estimated Value
Home Financials for this Owner
Home Financials are based on the most recent Mortgage that was taken out on this home.
Original Mortgage
$822,375
Interest Rate
2.9%
Mortgage Type
New Conventional
Purchase Details
Closed on
Sep 25, 2003
Sold by
Miroyan Peter V
Bought by
Miroyan Peter V
Home Financials for this Owner
Home Financials are based on the most recent Mortgage that was taken out on this home.
Original Mortgage
$178,200
Interest Rate
6.22%
Mortgage Type
Unknown
Purchase Details
Closed on
Aug 12, 1998
Sold by
Miroyan Christie L
Bought by
Miroyan Peter V
Create a Home Valuation Report for This Property
The Home Valuation Report is an in-depth analysis detailing your home's value as well as a comparison with similar homes in the area
Home Values in the Area
Average Home Value in this Area
Purchase History
| Date | Buyer | Sale Price | Title Company |
|---|---|---|---|
| Miroyan Peter Vartkes | -- | Old Republic Title Company | |
| Miroyan Peter V | -- | First American Title Co | |
| Miroyan Peter V | -- | -- |
Source: Public Records
Mortgage History
| Date | Status | Borrower | Loan Amount |
|---|---|---|---|
| Closed | Miroyan Peter Vartkes | $822,375 | |
| Closed | Miroyan Peter V | $178,200 |
Source: Public Records
Tax History
| Year | Tax Paid | Tax Assessment Tax Assessment Total Assessment is a certain percentage of the fair market value that is determined by local assessors to be the total taxable value of land and additions on the property. | Land | Improvement |
|---|---|---|---|---|
| 2025 | $9,986 | $800,371 | $137,373 | $662,998 |
| 2023 | $9,188 | $717,891 | $132,038 | $585,853 |
| 2022 | $8,027 | $610,285 | $129,449 | $480,836 |
| 2021 | $7,720 | $598,319 | $126,911 | $471,408 |
| 2020 | $7,631 | $592,184 | $125,610 | $466,574 |
| 2019 | $7,453 | $580,573 | $123,147 | $457,426 |
| 2018 | $7,324 | $569,189 | $120,732 | $448,457 |
| 2017 | $7,219 | $558,028 | $118,364 | $439,664 |
| 2016 | $6,844 | $547,086 | $116,043 | $431,043 |
Source: Public Records
Map
Nearby Homes
- 3233 Maplethorpe Ln
- 5493 Ball Dr
- 115 Darlington Ln
- 109 Darlington Ln
- 103 Darlington Ln
- 5425 Jigger Dr
- 3069 Arlington Dr
- 6125 Abbey Rd
- 6247 Cabot Ct
- 5606 Soquel Dr
- 2623 Willowbrook Ln Unit 118
- 3015 Arlington Dr
- 2921 Crocker Ct
- 0 Crestline Way
- 3006 Atherton Dr
- 2607 Willowbrook Ln Unit 58
- 2607 Willowbrook Ln Unit 54
- 2603 Willowbrook Ln Unit 22
- 27 Pepperwood Way Unit 27
- 17 Pepperwood Way Unit 17
- 3479 Maplethorpe Ln
- 3495 Maplethorpe Ln
- 3459 Maplethorpe Ln
- 3497 Maplethorpe Ln
- 3457 Maplethorpe Ln
- 3410 Victory Ln
- 3405 Victory Ln
- 3449 Maplethorpe Ln
- 3480 Maplethorpe Ln
- 3453 Maplethorpe Ln
- 3401 Victory Ln
- 3409 Victory Ln
- 3500 Maplethorpe Ln
- 3455 Maplethorpe Ln
- 3490 Maplethorpe Ln
- 3430 Maplethorpe Ln
- 3411 Victory Ln
- 3417 Victory Ln
- 3378 Maplethorpe Ln
- 3405 Maplethorpe Ln
Your Personal Tour Guide
Ask me questions while you tour the home.