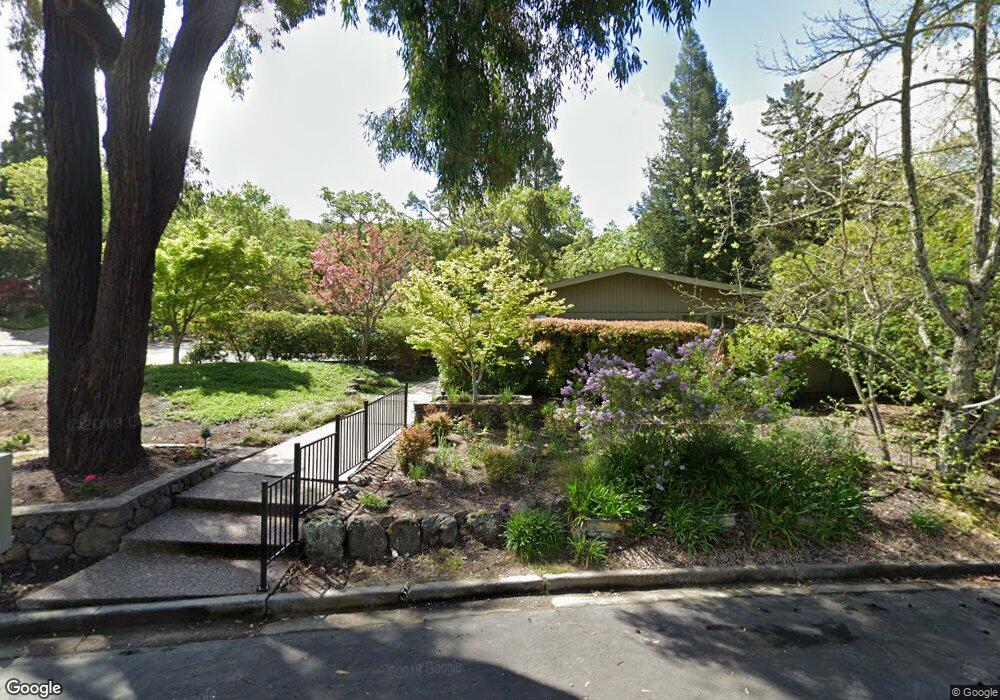
3469 S Silver Springs Rd Lafayette, CA 94549
Estimated Value: $2,296,520 - $2,868,000
5
Beds
2
Baths
2,204
Sq Ft
$1,128/Sq Ft
Est. Value
About This Home
This home is located at 3469 S Silver Springs Rd, Lafayette, CA 94549 and is currently estimated at $2,485,130, approximately $1,127 per square foot. 3469 S Silver Springs Rd is a home located in Contra Costa County with nearby schools including Lafayette Elementary School, Stanley Middle School, and Acalanes High School.
Ownership History
Date
Name
Owned For
Owner Type
Purchase Details
Closed on
Aug 14, 2020
Sold by
Bizot Christopher and Bizot Sunny
Bought by
Bizot Christopher D and Bizot Sunny
Current Estimated Value
Purchase Details
Closed on
Jun 4, 2019
Sold by
Herr Hazel H
Bought by
Bizot Christopher and Bizot Sunny
Home Financials for this Owner
Home Financials are based on the most recent Mortgage that was taken out on this home.
Original Mortgage
$1,584,000
Outstanding Balance
$1,355,988
Interest Rate
2.87%
Mortgage Type
Adjustable Rate Mortgage/ARM
Estimated Equity
$1,129,142
Purchase Details
Closed on
Jul 25, 2014
Sold by
Herr Hazel H
Bought by
Herr Hazel H
Purchase Details
Closed on
Feb 26, 1998
Sold by
Hamlin Properties
Bought by
Herr Hazel H
Create a Home Valuation Report for This Property
The Home Valuation Report is an in-depth analysis detailing your home's value as well as a comparison with similar homes in the area
Home Values in the Area
Average Home Value in this Area
Purchase History
| Date | Buyer | Sale Price | Title Company |
|---|---|---|---|
| Bizot Christopher D | -- | None Available | |
| Bizot Christopher | $1,980,000 | Chicago Title Company | |
| Herr Hazel H | -- | None Available | |
| Herr Hazel H | -- | Old Republic Title | |
| Hamlin Properties | -- | Old Republic Title |
Source: Public Records
Mortgage History
| Date | Status | Borrower | Loan Amount |
|---|---|---|---|
| Open | Bizot Christopher | $1,584,000 |
Source: Public Records
Tax History Compared to Growth
Tax History
| Year | Tax Paid | Tax Assessment Tax Assessment Total Assessment is a certain percentage of the fair market value that is determined by local assessors to be the total taxable value of land and additions on the property. | Land | Improvement |
|---|---|---|---|---|
| 2025 | $25,624 | $2,208,722 | $1,450,172 | $758,550 |
| 2024 | $25,188 | $2,165,415 | $1,421,738 | $743,677 |
| 2023 | $25,188 | $2,122,957 | $1,393,861 | $729,096 |
| 2022 | $24,804 | $2,081,331 | $1,366,531 | $714,800 |
| 2021 | $24,086 | $2,040,522 | $1,339,737 | $700,785 |
| 2019 | $3,530 | $206,907 | $85,728 | $121,179 |
| 2018 | $2,814 | $202,851 | $84,048 | $118,803 |
| 2017 | $2,739 | $198,874 | $82,400 | $116,474 |
| 2016 | $2,664 | $194,976 | $80,785 | $114,191 |
| 2015 | $2,576 | $192,048 | $79,572 | $112,476 |
| 2014 | $2,530 | $188,287 | $78,014 | $110,273 |
Source: Public Records
Map
Nearby Homes
- 783 Solana Dr
- 0 Hamlin Rd Unit 41110057
- 3399 Sweet Dr
- 840 Broadmoor Ct
- 828 Rosedale Ave
- 3580 Boyer Cir
- 9 Burton Vista Ct
- 1 Scenic Ln
- 891 Bell St
- 3665 Boyer Cir
- 3296 Walnut Ln
- 3364 Las Huertas Rd
- 38 Lenelle Ct
- 645 Evelyn Ct
- 950 Hough Ave
- 950 Hough Ave Unit 201
- 950 Hough Ave Unit 307
- 950 Hough Ave Unit 209
- 950 Hough Ave Unit 303
- 682 Jennie Ct
- 3477 S Silver Springs Rd
- 758 Grondine Dr
- 762 Grondine Dr
- 3485 S Silver Springs Rd
- 750 Grondine Dr
- 3468 S Silver Springs Rd
- 3465 S Silver Springs Rd
- 3484 S Silver Springs Rd
- 761 Silver Crest Ct
- 3491 S Silver Springs Rd
- 755 Silver Crest Ct
- 3475 Silver Springs Rd
- 767 Silver Crest Ct
- 744 Grondine Dr
- 3461 S Silver Springs Rd
- 3490 S Silver Springs Rd
- 3497 S Silver Springs Rd
- 3459 Silver Springs Rd
- 3487 Silver Springs Rd
- 3493 Silver Springs Rd