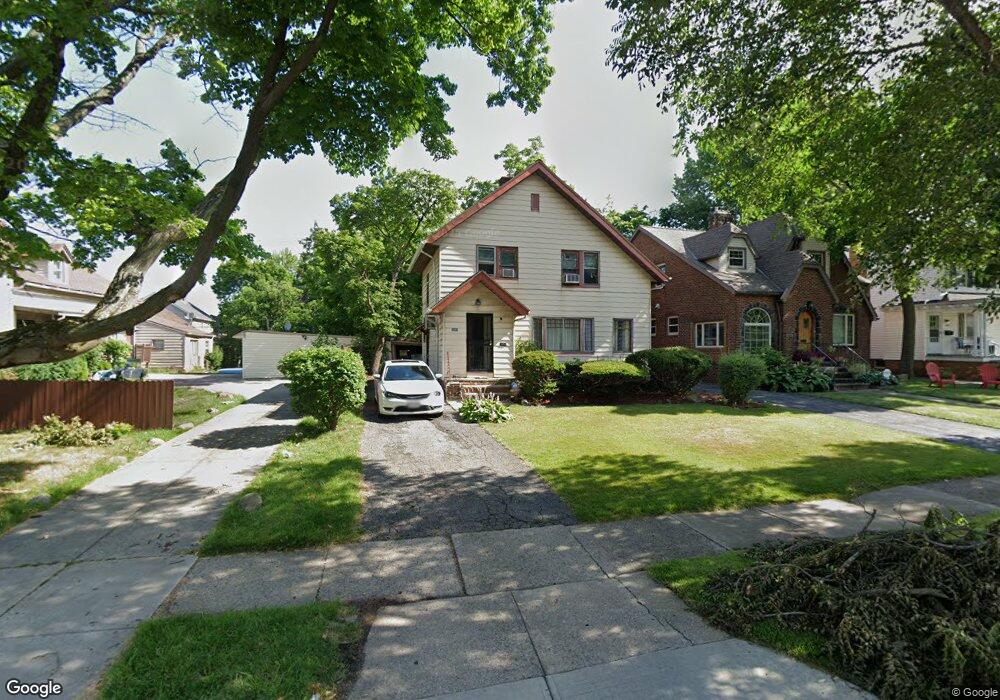
3469 Silsby Rd Cleveland, OH 44118
Estimated Value: $167,000 - $206,000
3
Beds
2
Baths
1,233
Sq Ft
$151/Sq Ft
Est. Value
About This Home
This home is located at 3469 Silsby Rd, Cleveland, OH 44118 and is currently estimated at $185,960, approximately $150 per square foot. 3469 Silsby Rd is a home located in Cuyahoga County with nearby schools including Canterbury Elementary School, Roxboro Middle School, and Cleveland Heights High School.
Ownership History
Date
Name
Owned For
Owner Type
Purchase Details
Closed on
Sep 22, 1989
Sold by
Stolarsky Philip M
Bought by
Minor Gerald G
Current Estimated Value
Purchase Details
Closed on
Mar 15, 1988
Bought by
Stolarsky Philip M
Purchase Details
Closed on
Jan 14, 1988
Sold by
William Martin
Bought by
Continental Federal Savings
Purchase Details
Closed on
Jun 28, 1985
Sold by
Scott James E
Bought by
William Martin
Purchase Details
Closed on
Feb 4, 1985
Sold by
Martin William
Bought by
Scott James E
Purchase Details
Closed on
Mar 27, 1984
Sold by
Scott James E
Bought by
Martin William
Purchase Details
Closed on
Jul 12, 1977
Sold by
Lester Louis
Bought by
Scott James E
Purchase Details
Closed on
Dec 5, 1975
Sold by
Lester Louis and Lester Rae S
Bought by
Lester Louis
Purchase Details
Closed on
Jan 1, 1975
Bought by
Lester Louis and Lester Rae S
Create a Home Valuation Report for This Property
The Home Valuation Report is an in-depth analysis detailing your home's value as well as a comparison with similar homes in the area
Home Values in the Area
Average Home Value in this Area
Purchase History
| Date | Buyer | Sale Price | Title Company |
|---|---|---|---|
| Minor Gerald G | $49,900 | -- | |
| Stolarsky Philip M | $31,500 | -- | |
| Continental Federal Savings | -- | -- | |
| William Martin | -- | -- | |
| Scott James E | -- | -- | |
| Martin William | -- | -- | |
| Scott James E | $15,000 | -- | |
| Lester Louis | $15,000 | -- | |
| Lester Louis | -- | -- | |
| Lester Louis | -- | -- |
Source: Public Records
Tax History Compared to Growth
Tax History
| Year | Tax Paid | Tax Assessment Tax Assessment Total Assessment is a certain percentage of the fair market value that is determined by local assessors to be the total taxable value of land and additions on the property. | Land | Improvement |
|---|---|---|---|---|
| 2024 | $3,721 | $52,395 | $12,635 | $39,760 |
| 2023 | $3,234 | $37,980 | $8,960 | $29,020 |
| 2022 | $3,263 | $37,975 | $8,960 | $29,015 |
| 2021 | $3,199 | $37,980 | $8,960 | $29,020 |
| 2020 | $3,051 | $33,920 | $8,020 | $25,900 |
| 2019 | $2,888 | $96,900 | $22,900 | $74,000 |
| 2018 | $2,890 | $33,920 | $8,020 | $25,900 |
| 2017 | $4,102 | $32,840 | $6,410 | $26,430 |
| 2016 | $3,264 | $32,840 | $6,410 | $26,430 |
| 2015 | $2,712 | $32,840 | $6,410 | $26,430 |
| 2014 | $2,712 | $32,210 | $6,270 | $25,940 |
Source: Public Records
Map
Nearby Homes
- 2272 S Taylor Rd
- 3485 Silsby Rd
- 3395 Tullamore Rd
- 3383 Tullamore Rd
- 3368 Silsby Rd
- 3366 Tullamore Rd
- 3365 Meadowbrook Blvd
- 3540 Silsby Rd
- 3331 Cedarbrook Rd
- 3494 Raymont Blvd
- 3593 Tullamore Rd
- 2119 Rossmoor Rd
- 3302 Tullamore Rd
- 3528 Meadowbrook Blvd
- 3554 Raymont Blvd
- 3525 Raymont Blvd
- 3333 Ormond Rd
- 3300 Kildare Rd
- 2127 Goodnor Rd
- 3288 Kildare Rd
- 3471 Silsby Rd
- 3475 Silsby Rd
- 2263 S Taylor Rd
- 2259 S Taylor Rd
- 3483 Silsby Rd
- 2255 S Taylor Rd
- 3470 Tullamore Rd
- 3474 Tullamore Rd
- 2251 S Taylor Rd
- 3478 Tullamore Rd
- 3440 Silsby Rd
- 3482 Tullamore Rd
- 3452 Silsby Rd
- 3448 Silsby Rd
- 3489 Silsby Rd
- 3456 Silsby Rd
- 2285 S Taylor Rd
- 3486 Tullamore Rd
- 3460 Silsby Rd
- 3493 Silsby Rd