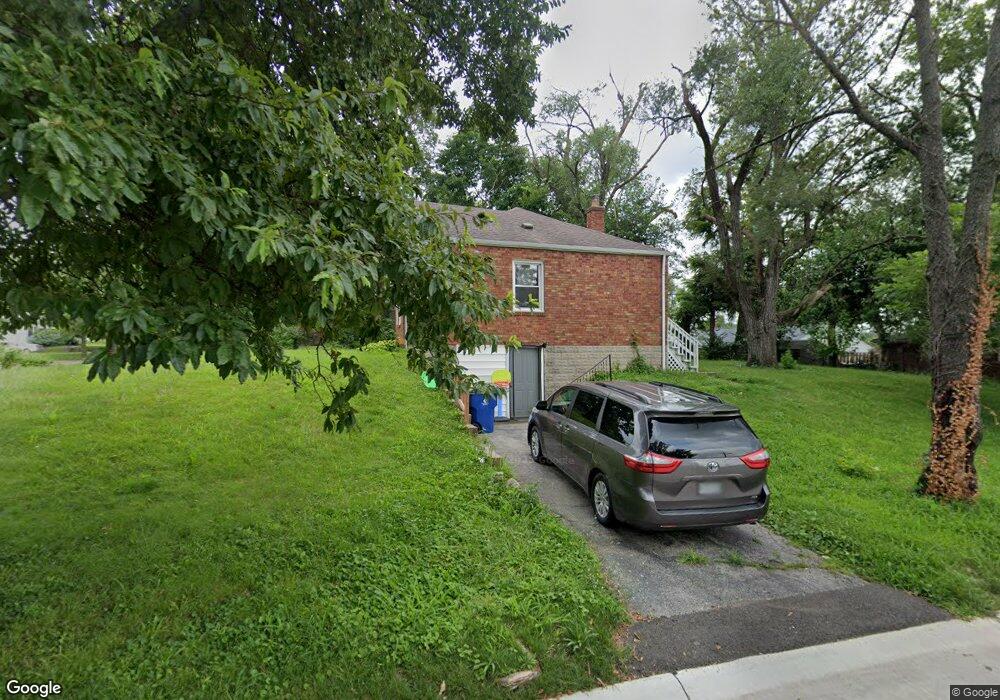
3469 Westridge Ln Saint Ann, MO 63074
Estimated Value: $108,000 - $152,000
3
Beds
1
Bath
864
Sq Ft
$149/Sq Ft
Est. Value
About This Home
This home is located at 3469 Westridge Ln, Saint Ann, MO 63074 and is currently estimated at $128,792, approximately $149 per square foot. 3469 Westridge Ln is a home located in St. Louis County with nearby schools including Buder Elementary School, Hoech Middle School, and Ritenour Senior High School.
Ownership History
Date
Name
Owned For
Owner Type
Purchase Details
Closed on
Mar 15, 2021
Sold by
Allied Property Group Llc
Bought by
Ser3 020 Llc
Current Estimated Value
Purchase Details
Closed on
Apr 17, 2000
Sold by
Noel Larry J and Noel Bonnie J
Bought by
Jost Aaron Richard
Home Financials for this Owner
Home Financials are based on the most recent Mortgage that was taken out on this home.
Original Mortgage
$26,000
Interest Rate
8.24%
Purchase Details
Closed on
Sep 25, 1998
Sold by
Franco Ida G
Bought by
Noel Larry J and Noel Bonnie J
Home Financials for this Owner
Home Financials are based on the most recent Mortgage that was taken out on this home.
Original Mortgage
$24,500
Interest Rate
6.81%
Create a Home Valuation Report for This Property
The Home Valuation Report is an in-depth analysis detailing your home's value as well as a comparison with similar homes in the area
Home Values in the Area
Average Home Value in this Area
Purchase History
| Date | Buyer | Sale Price | Title Company |
|---|---|---|---|
| Ser3 020 Llc | $52,000 | True Title Company Llc | |
| Sfr3-020 Llc | -- | True Title | |
| Allied Property Group Llc | $22,000 | True Title Company Llc | |
| Allied Property Group Llc | -- | True Title | |
| Jost Aaron Richard | $64,000 | -- | |
| Noel Larry J | -- | -- |
Source: Public Records
Mortgage History
| Date | Status | Borrower | Loan Amount |
|---|---|---|---|
| Previous Owner | Jost Aaron Richard | $26,000 | |
| Previous Owner | Noel Larry J | $24,500 |
Source: Public Records
Tax History Compared to Growth
Tax History
| Year | Tax Paid | Tax Assessment Tax Assessment Total Assessment is a certain percentage of the fair market value that is determined by local assessors to be the total taxable value of land and additions on the property. | Land | Improvement |
|---|---|---|---|---|
| 2025 | $2,116 | $24,870 | $4,900 | $19,970 |
| 2024 | $2,116 | $21,510 | $4,260 | $17,250 |
| 2023 | $2,116 | $21,510 | $4,260 | $17,250 |
| 2022 | $1,614 | $15,410 | $4,260 | $11,150 |
| 2021 | $1,613 | $15,410 | $4,260 | $11,150 |
| 2020 | $1,535 | $13,450 | $3,270 | $10,180 |
| 2019 | $1,519 | $13,450 | $3,270 | $10,180 |
| 2018 | $1,477 | $11,760 | $3,250 | $8,510 |
| 2017 | $1,397 | $11,760 | $3,250 | $8,510 |
| 2016 | $1,263 | $11,590 | $3,250 | $8,340 |
| 2015 | $1,291 | $11,590 | $3,250 | $8,340 |
| 2014 | $1,292 | $11,800 | $1,480 | $10,320 |
Source: Public Records
Map
Nearby Homes
- 3447 Eastridge Ln
- 10107 Saint Katherine Ln
- 3346 Saint Joachim Ln
- 10225 Saint Katherine Ln
- 3520 Wismer Rd
- 3529 Saint Joachim Ln
- 3550 Saint Joachim Ln
- 3569 Saint Gregory Ln
- 3548 Saint Genevieve Ln
- 3365 Marmary Ln
- 3446 Saint Clovis Ln
- 3650 Elsa Ave
- 3246 Saint Joachim Ln
- 3327 Krem Ct
- 3643 Elsa Ave
- 3244 Chaucer Ave
- 3239 Chaucer Ave
- 10300 Saint Katherine Ln
- 3678 Elsa Ave
- 3442 Saint Donald Ln
- 3300 Saint Gregory Ln
- 3463 Westridge Ln
- 3501 Westridge Ln
- 3456 Wright Ave
- 3457 Westridge Ln
- 3301 Saint Gregory Ln
- 3450 Wright Ave
- 3507 Westridge Ln
- 3528 Wright Ave
- 3451 Westridge Ln
- 3462 Westridge Ln
- 3405 Saint Gregory Ln
- 3446 Wright Ave
- 3513 Westridge Ln
- 3456 Westridge Ln
- 3532 Wright Ave
- 3449 Wright Ave
- 3445 Wright Ave
- 3445 Westridge Ln
- 3407 Saint Gregory Ln