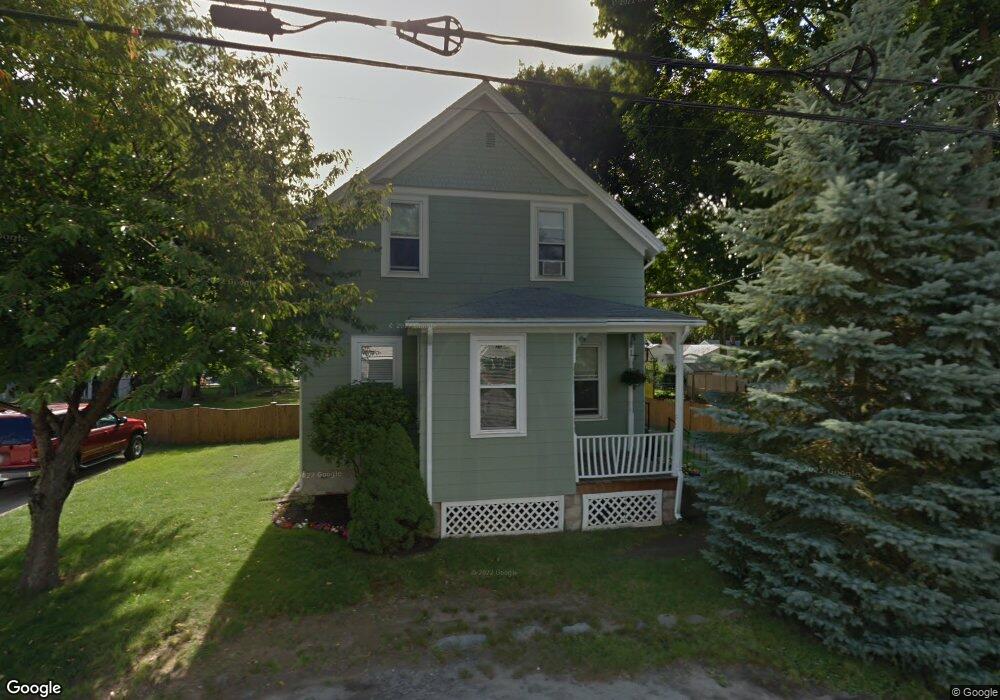
347 Bryant St Cumberland, RI 02864
Valley Falls NeighborhoodEstimated Value: $443,397 - $470,000
3
Beds
2
Baths
1,146
Sq Ft
$395/Sq Ft
Est. Value
About This Home
This home is located at 347 Bryant St, Cumberland, RI 02864 and is currently estimated at $452,849, approximately $395 per square foot. 347 Bryant St is a home located in Providence County with nearby schools including B.F. Norton Elementary School, Joseph L. McCourt Middle School, and Cumberland High School.
Ownership History
Date
Name
Owned For
Owner Type
Purchase Details
Closed on
Mar 29, 1999
Sold by
Hilton David M and Hilton Deborah
Bought by
Choiniere Janice E
Current Estimated Value
Home Financials for this Owner
Home Financials are based on the most recent Mortgage that was taken out on this home.
Original Mortgage
$98,000
Interest Rate
6.78%
Mortgage Type
Purchase Money Mortgage
Purchase Details
Closed on
Jun 1, 1990
Sold by
Hogan Stephen F
Bought by
Hilton David M
Create a Home Valuation Report for This Property
The Home Valuation Report is an in-depth analysis detailing your home's value as well as a comparison with similar homes in the area
Home Values in the Area
Average Home Value in this Area
Purchase History
| Date | Buyer | Sale Price | Title Company |
|---|---|---|---|
| Choiniere Janice E | $123,000 | -- | |
| Hilton David M | $119,000 | -- |
Source: Public Records
Mortgage History
| Date | Status | Borrower | Loan Amount |
|---|---|---|---|
| Open | Hilton David M | $168,000 | |
| Closed | Hilton David M | $87,518 | |
| Closed | Hilton David M | $98,000 | |
| Previous Owner | Hilton David M | $118,816 |
Source: Public Records
Tax History
| Year | Tax Paid | Tax Assessment Tax Assessment Total Assessment is a certain percentage of the fair market value that is determined by local assessors to be the total taxable value of land and additions on the property. | Land | Improvement |
|---|---|---|---|---|
| 2025 | $3,975 | $324,000 | $146,800 | $177,200 |
| 2024 | $3,872 | $324,000 | $146,800 | $177,200 |
| 2023 | $3,765 | $324,000 | $146,800 | $177,200 |
| 2022 | $3,355 | $223,800 | $102,600 | $121,200 |
| 2021 | $3,299 | $223,800 | $102,600 | $121,200 |
| 2020 | $3,205 | $223,800 | $102,600 | $121,200 |
| 2019 | $2,882 | $181,500 | $85,700 | $95,800 |
| 2018 | $2,799 | $181,500 | $85,700 | $95,800 |
| 2017 | $2,761 | $181,500 | $85,700 | $95,800 |
| 2016 | $2,571 | $150,500 | $78,100 | $72,400 |
| 2015 | $2,571 | $150,500 | $78,100 | $72,400 |
| 2014 | $5,784 | $150,500 | $78,100 | $72,400 |
| 2013 | $2,829 | $179,300 | $77,700 | $101,600 |
Source: Public Records
Map
Nearby Homes
- 46 Ann St
- 60 Highland Ave
- 15 E Earle St
- 789 High St
- 50 Blackstone St
- 311 High St
- 27 Norman St
- 163 Woodside Ave
- 15 Susan Dr
- 33 Kent St
- 202 Marshall Ave
- 36 Dexter St
- 11 Woodside Ave
- 0 Adamsdale Rd
- 407-409 Broad St
- 44 Eddy St
- 500 Mendon Rd Unit 257
- 98 Iroquois Rd
- 0 Mendon Road (Rear)
- 24 Narragansett Ave
Your Personal Tour Guide
Ask me questions while you tour the home.