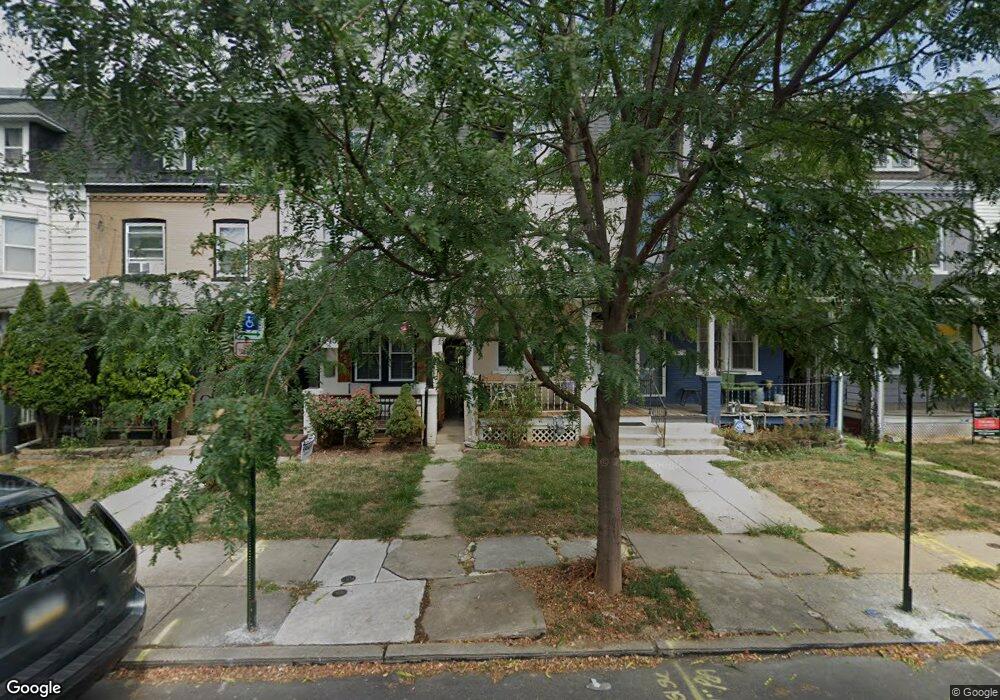
347 E Ross St Lancaster, PA 17602
Ross NeighborhoodEstimated Value: $243,603 - $252,000
4
Beds
1
Bath
1,492
Sq Ft
$166/Sq Ft
Est. Value
About This Home
This home is located at 347 E Ross St, Lancaster, PA 17602 and is currently estimated at $248,401, approximately $166 per square foot. 347 E Ross St is a home located in Lancaster County with nearby schools including Ross Elementary School, Lincoln Middle School, and McCaskey High School.
Ownership History
Date
Name
Owned For
Owner Type
Purchase Details
Closed on
Feb 12, 2026
Sold by
Paniagua Manuel J and Paniagua Isabel M
Bought by
Mallqui Gloria E Apolinario and Solano Teodora Alejandra
Current Estimated Value
Home Financials for this Owner
Home Financials are based on the most recent Mortgage that was taken out on this home.
Original Mortgage
$10,000
Outstanding Balance
$10,000
Interest Rate
6.06%
Estimated Equity
$238,401
Create a Home Valuation Report for This Property
The Home Valuation Report is an in-depth analysis detailing your home's value as well as a comparison with similar homes in the area
Home Values in the Area
Average Home Value in this Area
Purchase History
| Date | Buyer | Sale Price | Title Company |
|---|---|---|---|
| Mallqui Gloria E Apolinario | $249,999 | Realty Settlement Services |
Source: Public Records
Mortgage History
| Date | Status | Borrower | Loan Amount |
|---|---|---|---|
| Open | Mallqui Gloria E Apolinario | $10,000 | |
| Open | Mallqui Gloria E Apolinario | $245,470 |
Source: Public Records
Tax History
| Year | Tax Paid | Tax Assessment Tax Assessment Total Assessment is a certain percentage of the fair market value that is determined by local assessors to be the total taxable value of land and additions on the property. | Land | Improvement |
|---|---|---|---|---|
| 2025 | $3,632 | $91,800 | $17,800 | $74,000 |
| 2024 | $3,632 | $91,800 | $17,800 | $74,000 |
| 2023 | $3,571 | $91,800 | $17,800 | $74,000 |
| 2022 | $3,423 | $91,800 | $17,800 | $74,000 |
| 2021 | $3,349 | $91,800 | $17,800 | $74,000 |
| 2020 | $3,349 | $91,800 | $17,800 | $74,000 |
| 2019 | $3,299 | $91,800 | $17,800 | $74,000 |
| 2018 | $1,521 | $91,800 | $17,800 | $74,000 |
| 2017 | $3,041 | $66,200 | $15,500 | $50,700 |
| 2016 | $3,013 | $66,200 | $15,500 | $50,700 |
| 2015 | $1,175 | $66,200 | $15,500 | $50,700 |
| 2014 | $2,202 | $66,200 | $15,500 | $50,700 |
Source: Public Records
Map
Nearby Homes
- 826 N Plum St
- 804 N Plum St
- 932 N Plum St
- 218 E Ross St
- 235 E New St
- 213 E Ross St
- 716 N Lime St
- 621 N Lime St
- 147 E Liberty St
- 1022 N Lime St
- 550 N Plum St
- 128 E New St
- 701 703 N Duke St
- 830 N Duke St
- 1103 Frances Ave
- 13 E New St
- 752 New Holland Ave
- 762 New Holland Ave
- 766 New Holland Ave
- 16 W Liberty St
Your Personal Tour Guide
Ask me questions while you tour the home.