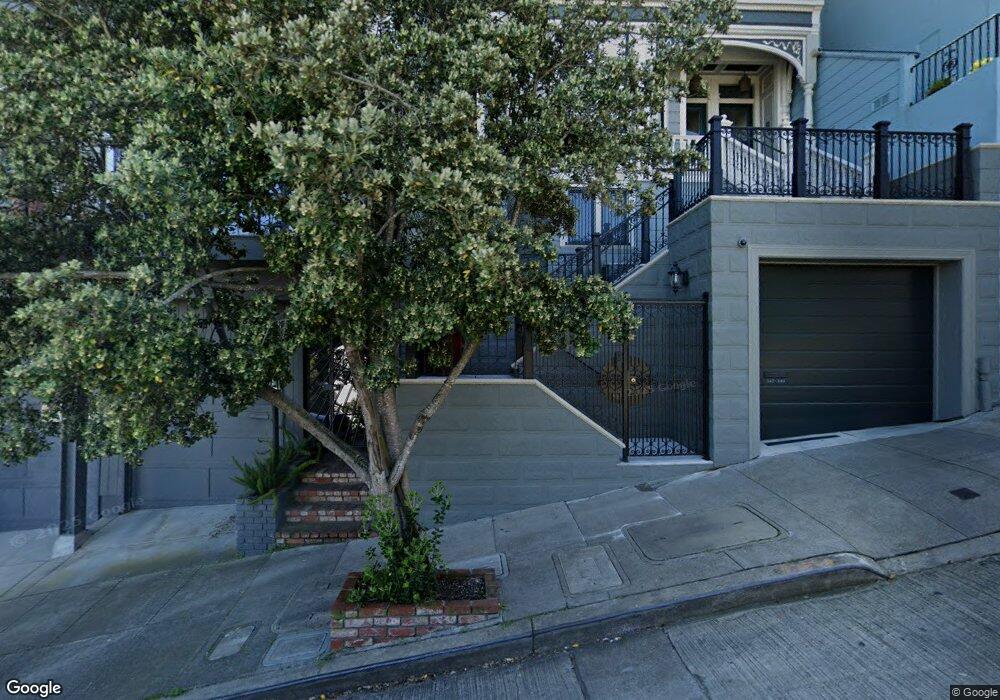
347 Liberty St San Francisco, CA 94114
Eureka Valley-Dolores Heights NeighborhoodEstimated Value: $2,859,000 - $6,056,669
4
Beds
5
Baths
4,050
Sq Ft
$1,137/Sq Ft
Est. Value
About This Home
This home is located at 347 Liberty St, San Francisco, CA 94114 and is currently estimated at $4,604,167, approximately $1,136 per square foot. 347 Liberty St is a home located in San Francisco County with nearby schools including Harvey Milk Civil Rights Academy, Everett Middle School, and Thomas Edison Charter Academy.
Ownership History
Date
Name
Owned For
Owner Type
Purchase Details
Closed on
Jul 29, 2022
Sold by
Jonathan S Benjamin Sf Duplex Trust
Bought by
Patricia A Benjamin Trust
Current Estimated Value
Purchase Details
Closed on
Dec 19, 2012
Sold by
Benjamin Patricia A
Bought by
Ivancie John Michael
Purchase Details
Closed on
Dec 12, 2012
Sold by
Benjamin Jonathan S and Benjamin Patricia A
Bought by
Benjamin Jonathan S and Benjamin Patricia A
Purchase Details
Closed on
Mar 3, 2008
Sold by
Clark Harry and Collins Joseph F
Bought by
Benjamin Jonathan S and Benjamin Patricia A
Purchase Details
Closed on
Aug 6, 2005
Sold by
Evers David K
Bought by
Clark Harry and Collins Joseph F
Home Financials for this Owner
Home Financials are based on the most recent Mortgage that was taken out on this home.
Original Mortgage
$1,650,000
Interest Rate
5.61%
Mortgage Type
Seller Take Back
Create a Home Valuation Report for This Property
The Home Valuation Report is an in-depth analysis detailing your home's value as well as a comparison with similar homes in the area
Home Values in the Area
Average Home Value in this Area
Purchase History
| Date | Buyer | Sale Price | Title Company |
|---|---|---|---|
| Patricia A Benjamin Trust | $1,850,000 | Fidelity National Title | |
| Patricia A Benjamin Trust | $1,850,000 | Fidelity National Title | |
| Ivancie John Michael | -- | None Available | |
| Ivancie John Michael | -- | None Available | |
| Benjamin Jonathan S | -- | None Available | |
| Benjamin Jonathan S | $3,330,000 | Chicago Title Company | |
| Clark Harry | -- | Chicago Title Company |
Source: Public Records
Mortgage History
| Date | Status | Borrower | Loan Amount |
|---|---|---|---|
| Previous Owner | Clark Harry | $1,650,000 |
Source: Public Records
Tax History Compared to Growth
Tax History
| Year | Tax Paid | Tax Assessment Tax Assessment Total Assessment is a certain percentage of the fair market value that is determined by local assessors to be the total taxable value of land and additions on the property. | Land | Improvement |
|---|---|---|---|---|
| 2025 | $48,798 | $4,161,600 | $2,913,120 | $1,248,480 |
| 2024 | $48,798 | $4,080,000 | $2,856,000 | $1,224,000 |
| 2023 | $57,823 | $4,834,626 | $2,941,646 | $1,892,980 |
| 2022 | $56,672 | $4,739,853 | $2,883,977 | $1,855,876 |
| 2021 | $55,684 | $4,646,916 | $2,827,429 | $1,819,487 |
| 2020 | $56,081 | $4,599,270 | $2,798,438 | $1,800,832 |
| 2019 | $53,954 | $4,509,090 | $2,743,567 | $1,765,523 |
| 2018 | $52,134 | $4,420,677 | $2,689,772 | $1,730,905 |
| 2017 | $51,221 | $4,333,999 | $2,637,032 | $1,696,967 |
| 2016 | $50,478 | $4,249,020 | $2,585,326 | $1,663,694 |
| 2015 | $49,861 | $4,185,197 | $2,546,492 | $1,638,705 |
| 2014 | $48,544 | $4,103,216 | $2,496,610 | $1,606,606 |
Source: Public Records
Map
Nearby Homes
- 376 Hill St
- 3960 20th St
- 785 Dolores St
- 795 Dolores St
- 3838 19th St
- 3939 19th St Unit 3939
- 592 Sanchez St
- 29 Hancock St
- 3821 23rd St
- 3451 22nd St
- 72-74 Cumberland St
- 3879 23rd St
- 892-894 Guerrero St
- 20-24 Cumberland St
- 1161 Church St
- 228 Vicksburg St Unit 3
- 269 Chattanooga St
- 49 Liberty St Unit 2
- 3347 21st St
- 3346 21st St Unit 3346
- 351 Liberty St
- 345 Liberty St
- 343 Liberty St Unit 345
- 355 Liberty St
- 337 Liberty St Unit 341
- 365 Liberty St
- 333 Liberty St
- 367 Liberty St
- 331 Liberty St
- 329 Liberty St
- 3650 21st St
- 3640 21st St
- 3646 21st St
- 3636 21st St
- 369 Liberty St
- 307 Liberty St
- 3660 21st St
- 3632 21st St Unit 3632A
- 373 Liberty St
- 305 Liberty St