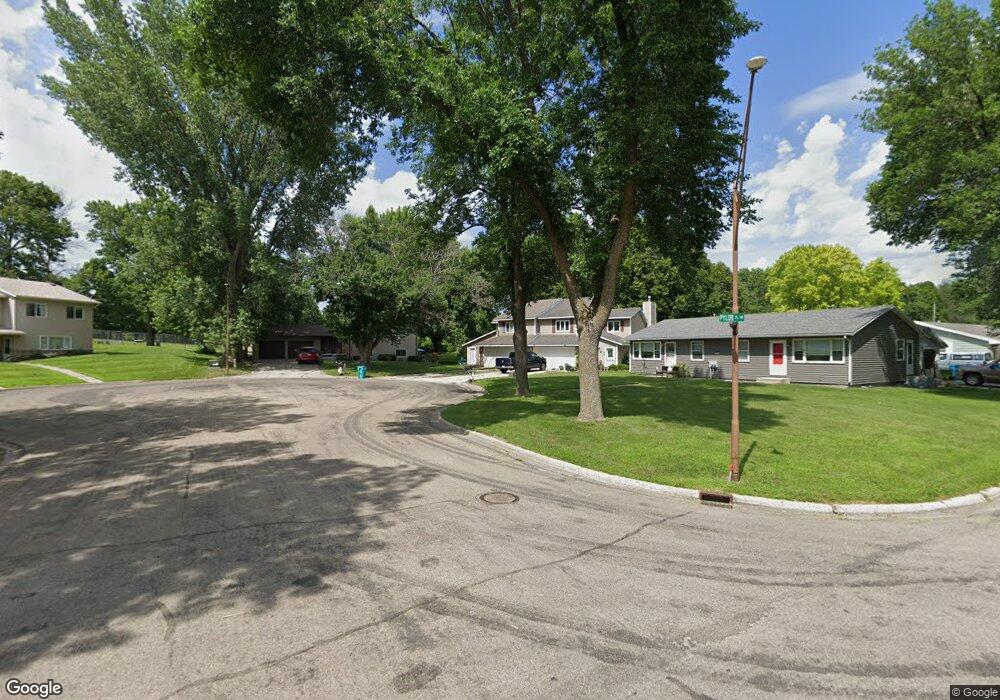
347 Pylor Place Owatonna, MN 55060
Estimated Value: $208,000 - $230,000
2
Beds
2
Baths
1,444
Sq Ft
$151/Sq Ft
Est. Value
About This Home
This home is located at 347 Pylor Place, Owatonna, MN 55060 and is currently estimated at $218,131, approximately $151 per square foot. 347 Pylor Place is a home located in Steele County with nearby schools including Wilson Elementary School, Owatonna Middle School, and Owatonna Senior High School.
Ownership History
Date
Name
Owned For
Owner Type
Purchase Details
Closed on
Sep 27, 2021
Sold by
Staska Janzen E and Staska Shelby
Bought by
Christesen Bradley and Christesen Lydia
Current Estimated Value
Home Financials for this Owner
Home Financials are based on the most recent Mortgage that was taken out on this home.
Original Mortgage
$11,800
Outstanding Balance
$7,567
Interest Rate
2.8%
Mortgage Type
New Conventional
Estimated Equity
$210,564
Purchase Details
Closed on
Jul 19, 2018
Sold by
Branderhorst Rose P
Bought by
Staska Janzen E
Home Financials for this Owner
Home Financials are based on the most recent Mortgage that was taken out on this home.
Original Mortgage
$127,645
Interest Rate
4.5%
Mortgage Type
FHA
Create a Home Valuation Report for This Property
The Home Valuation Report is an in-depth analysis detailing your home's value as well as a comparison with similar homes in the area
Home Values in the Area
Average Home Value in this Area
Purchase History
| Date | Buyer | Sale Price | Title Company |
|---|---|---|---|
| Christesen Bradley | $175,000 | None Available | |
| Staska Janzen E | $130,000 | North American Title | |
| Christesen Bradley Bradley | $175,000 | -- |
Source: Public Records
Mortgage History
| Date | Status | Borrower | Loan Amount |
|---|---|---|---|
| Open | Christesen Bradley | $11,800 | |
| Open | Christesen Bradley | $169,750 | |
| Previous Owner | Staska Janzen E | $127,645 | |
| Closed | Christesen Bradley Bradley | $175,000 |
Source: Public Records
Tax History Compared to Growth
Tax History
| Year | Tax Paid | Tax Assessment Tax Assessment Total Assessment is a certain percentage of the fair market value that is determined by local assessors to be the total taxable value of land and additions on the property. | Land | Improvement |
|---|---|---|---|---|
| 2025 | $1,986 | $190,400 | $20,000 | $170,400 |
| 2024 | $1,936 | $183,400 | $20,000 | $163,400 |
| 2023 | $1,982 | $171,900 | $20,000 | $151,900 |
| 2022 | $1,778 | $169,500 | $20,000 | $149,500 |
| 2021 | $2,138 | $145,334 | $19,600 | $125,734 |
| 2020 | $2,008 | $137,592 | $19,600 | $117,992 |
| 2019 | $1,950 | $126,322 | $15,680 | $110,642 |
| 2018 | $1,844 | $129,360 | $10,682 | $118,678 |
| 2017 | $1,718 | $123,480 | $10,094 | $113,386 |
| 2016 | $1,482 | $117,306 | $10,094 | $107,212 |
| 2015 | -- | $0 | $0 | $0 |
| 2014 | -- | $0 | $0 | $0 |
Source: Public Records
Map
Nearby Homes
- 116 Selby Ave
- 206 Selby Ave
- 468 Mound St
- 420 Fairview St
- 360 Thomas Ave
- 640 Lemond Rd
- 540 Allan Ave
- xxx Kilworth Dr NW
- 421 S Oak Ave
- 919 Mosher Ave
- 916 Linn Ave SW
- 231 E Pearl St
- xxx Anderson Place
- 604 S Elm Ave
- 316 E Pearl St
- 1015 Grandview Ave
- 1138 Hawthorne Ave
- 234 E School St
- 819 S Cedar Ave
- 1031 Grandview Ave
- 345 Pylor Place
- 355 Pylor Place
- 335 Pylor Place
- 656 Glendale St
- 648 Glendale St
- 340 Pylor Place
- 340 Pylor Place
- 350 Pylor Place
- 350 Pylor Place
- 330 Pylor Place
- 344 Pylor Place
- 344 Pylor Place
- 640 Glendale St
- 334 Pylor Place
- 334 Pylor Place
- 673 Glendale St
- 677 Glendale St
- 659 Glendale St
- 649 Glendale St
- 630 Glendale St