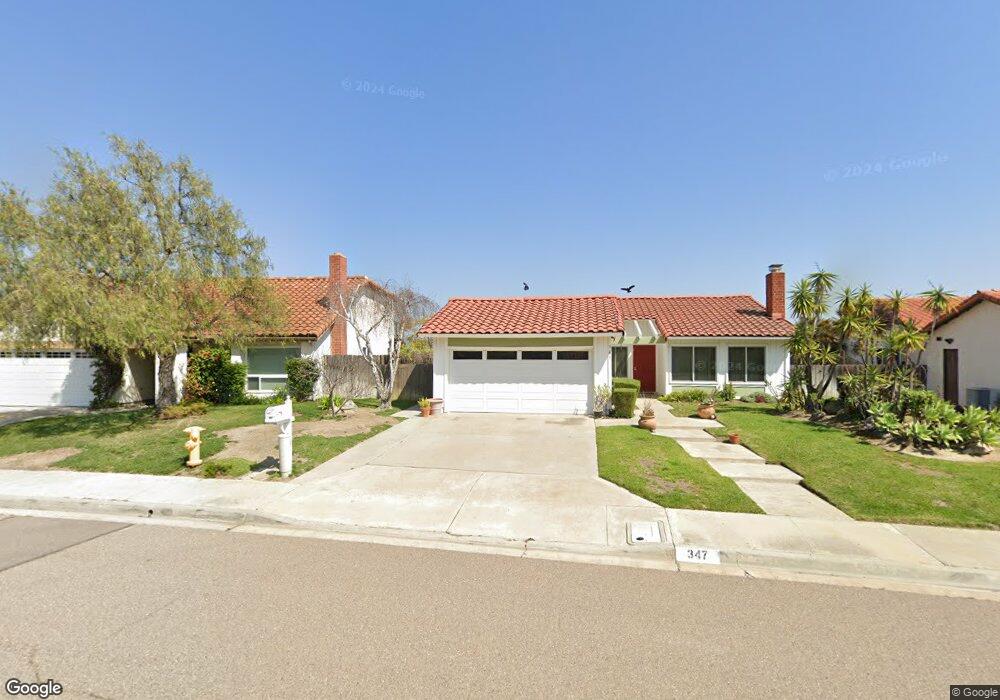
347 Trailview Rd Encinitas, CA 92024
Central Encinitas NeighborhoodEstimated Value: $1,481,563 - $1,706,000
3
Beds
2
Baths
1,296
Sq Ft
$1,243/Sq Ft
Est. Value
About This Home
This home is located at 347 Trailview Rd, Encinitas, CA 92024 and is currently estimated at $1,610,641, approximately $1,242 per square foot. 347 Trailview Rd is a home located in San Diego County with nearby schools including Park Dale Lane Elementary, Diegueno Middle School, and La Costa Canyon High School.
Ownership History
Date
Name
Owned For
Owner Type
Purchase Details
Closed on
May 7, 2025
Sold by
Mickshaw Raymond V
Bought by
Raymond V Mickshaw Trust and Mickshaw
Current Estimated Value
Purchase Details
Closed on
Aug 5, 2020
Sold by
Mickshaw Raymond and Mickshaw Beverly Jane
Bought by
Mickshaw Raymond
Purchase Details
Closed on
Sep 13, 2019
Sold by
Mickshaw Beverly Jane and Beverly Jane Mickshaw Living T
Bought by
Mickshaw Beverly Jane and Mickshaw Raymond
Purchase Details
Closed on
May 25, 2005
Sold by
Mickshaw Beverly Jane
Bought by
Beverly Jane Mickshaw Living Trust
Purchase Details
Closed on
Mar 20, 1992
Purchase Details
Closed on
Dec 29, 1988
Purchase Details
Closed on
Oct 16, 1986
Create a Home Valuation Report for This Property
The Home Valuation Report is an in-depth analysis detailing your home's value as well as a comparison with similar homes in the area
Home Values in the Area
Average Home Value in this Area
Purchase History
| Date | Buyer | Sale Price | Title Company |
|---|---|---|---|
| Raymond V Mickshaw Trust | -- | None Listed On Document | |
| Mickshaw Raymond | -- | None Available | |
| Mickshaw Beverly Jane | -- | None Available | |
| Beverly Jane Mickshaw Living Trust | -- | -- | |
| -- | $235,000 | -- | |
| -- | $231,300 | -- | |
| -- | $152,000 | -- |
Source: Public Records
Tax History
| Year | Tax Paid | Tax Assessment Tax Assessment Total Assessment is a certain percentage of the fair market value that is determined by local assessors to be the total taxable value of land and additions on the property. | Land | Improvement |
|---|---|---|---|---|
| 2025 | $4,976 | $415,534 | $247,557 | $167,977 |
| 2024 | $4,976 | $407,387 | $242,703 | $164,684 |
| 2023 | $4,815 | $399,400 | $237,945 | $161,455 |
| 2022 | $4,687 | $391,570 | $233,280 | $158,290 |
| 2021 | $4,596 | $383,893 | $228,706 | $155,187 |
| 2020 | $4,437 | $379,957 | $226,361 | $153,596 |
| 2019 | $4,351 | $372,508 | $221,923 | $150,585 |
| 2018 | $4,284 | $365,205 | $217,572 | $147,633 |
| 2017 | $4,213 | $358,045 | $213,306 | $144,739 |
| 2016 | $4,089 | $351,025 | $209,124 | $141,901 |
| 2015 | $4,005 | $345,753 | $205,983 | $139,770 |
| 2014 | $3,903 | $338,982 | $201,949 | $137,033 |
Source: Public Records
Map
Nearby Homes
- 516 Whisper Wind Dr
- 324 Countrywood Ln
- 2037 Countrywood Way
- 1830 Gatepost Rd
- 1824 Eastwood Ln
- 905 Olive Crest Dr
- 1986 Azure Way Unit 107
- 1971 Azure Way
- 612 Lucylle Ln
- 1741 Charleston Ln
- 1825 Hummock Ln
- 804 & 814 Clark Ave
- 3736 38 Via Rancho Michelle
- 200 202 Neptune Ave
- 772 Conestoga Ct
- 250 258 Hillcrest Dr
- 277 Via Del Cerrito
- 1733 Gentle Breeze Ln
- 824 Glen Arbor Dr
- 1709 Edgefield Ln
- 343 Trailview Rd
- 351 Trailview Rd
- 341 Trailview Rd
- 355 Trailview Rd
- 348 Trailview Rd
- 359 Trailview Rd
- 335 Trailview Rd
- 344 Trailview Rd
- 352 Trailview Rd
- 340 Trailview Rd
- 356 Trailview Rd
- 363 Trailview Rd
- 329 Trailview Rd Unit 9
- 336 Trailview Rd
- 360 Trailview Rd
- 323 Trailview Rd
- 345 Willowspring Dr N
- 367 Trailview Rd
- 2205 Running Spring Place
- 332 Trailview Rd
Your Personal Tour Guide
Ask me questions while you tour the home.