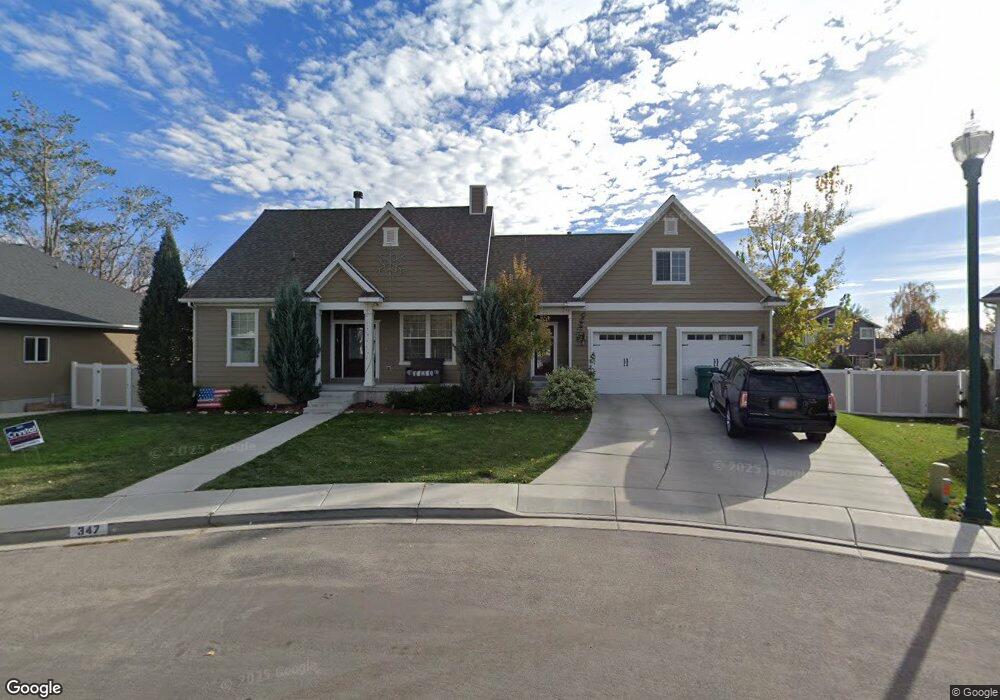
347 W 1945 N Orem, UT 84057
Northridge NeighborhoodEstimated Value: $628,000 - $696,759
3
Beds
2
Baths
3,380
Sq Ft
$196/Sq Ft
Est. Value
About This Home
This home is located at 347 W 1945 N, Orem, UT 84057 and is currently estimated at $662,253, approximately $195 per square foot. 347 W 1945 N is a home located in Utah County with nearby schools including Northridge Elementary School, Oak Canyon Junior High School, and Timpanogos High School.
Ownership History
Date
Name
Owned For
Owner Type
Purchase Details
Closed on
Sep 21, 2020
Sold by
Schellenberg Joshua D
Bought by
Sky Ridge Real Estate Llc
Current Estimated Value
Purchase Details
Closed on
Aug 26, 2014
Sold by
Patterson Construction Inc
Bought by
Schellenburg Joshua D
Home Financials for this Owner
Home Financials are based on the most recent Mortgage that was taken out on this home.
Original Mortgage
$230,250
Interest Rate
4.09%
Mortgage Type
New Conventional
Purchase Details
Closed on
Jul 29, 2011
Sold by
Sunset Mountain Properties Limited Partn
Bought by
Patterson Construction Inc
Create a Home Valuation Report for This Property
The Home Valuation Report is an in-depth analysis detailing your home's value as well as a comparison with similar homes in the area
Home Values in the Area
Average Home Value in this Area
Purchase History
| Date | Buyer | Sale Price | Title Company |
|---|---|---|---|
| Sky Ridge Real Estate Llc | -- | None Available | |
| Schellenburg Joshua D | -- | Provo Land Title Co | |
| Patterson Construction Inc | -- | Select Title Insurance Agenc |
Source: Public Records
Mortgage History
| Date | Status | Borrower | Loan Amount |
|---|---|---|---|
| Previous Owner | Schellenburg Joshua D | $230,250 |
Source: Public Records
Tax History
| Year | Tax Paid | Tax Assessment Tax Assessment Total Assessment is a certain percentage of the fair market value that is determined by local assessors to be the total taxable value of land and additions on the property. | Land | Improvement |
|---|---|---|---|---|
| 2025 | $2,666 | $341,055 | -- | -- |
| 2024 | $2,666 | $325,985 | $0 | $0 |
| 2023 | $2,534 | $333,025 | $0 | $0 |
| 2022 | $3,011 | $383,350 | $0 | $0 |
| 2021 | $2,736 | $527,700 | $179,700 | $348,000 |
| 2020 | $2,573 | $487,700 | $156,300 | $331,400 |
| 2019 | $2,255 | $444,500 | $156,300 | $288,200 |
| 2018 | $2,317 | $436,400 | $156,300 | $280,100 |
| 2017 | $2,188 | $220,715 | $0 | $0 |
| 2016 | $2,477 | $230,450 | $0 | $0 |
| 2015 | $2,593 | $228,140 | $0 | $0 |
| 2014 | $2,561 | $224,290 | $0 | $0 |
Source: Public Records
Map
Nearby Homes
- 1916 N 430 W
- 127 S 400 E
- 1744 N 280 W
- 49 W 1880 N
- 90 S 200 E
- 240 E Center St
- 1547 N 275 West St Unit 5
- 1566 N 275 West St Unit 1
- 1548 N 275 West St Unit 2
- 92 W 1565 N
- 1545 N State St Unit 1
- 229 E 60 N
- 1461 N Amiron Way Unit B
- 332 W Amiron Way Unit D
- 14 N 850 E
- 512 W 1450 N
- 1552 N 740 W
- 527 W 1450 N
- 1917 N 860 W
- 287 W 1380 N
Your Personal Tour Guide
Ask me questions while you tour the home.