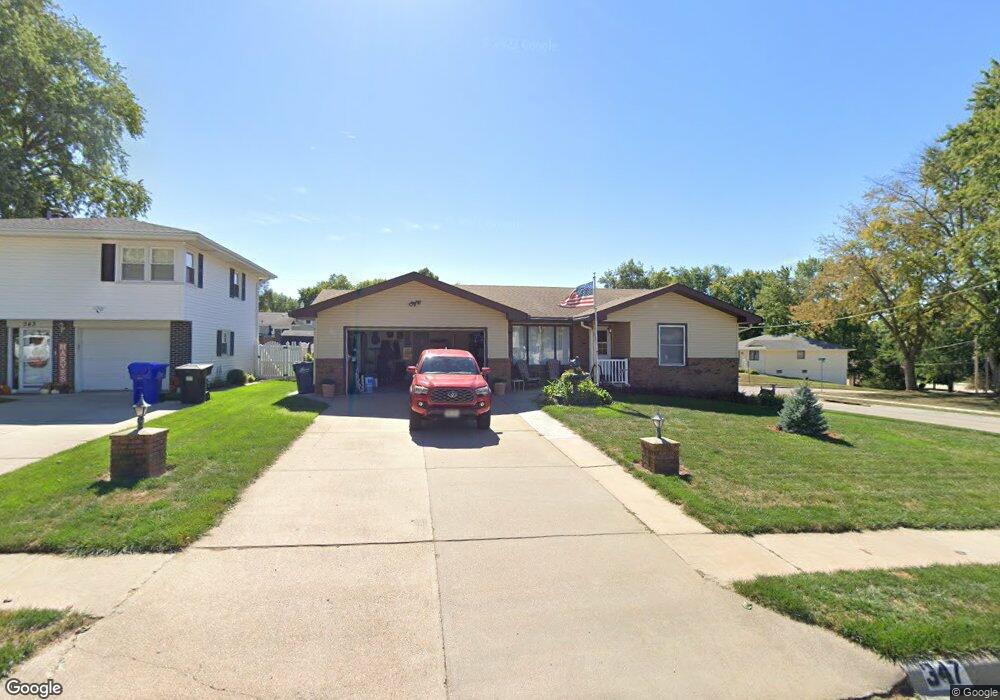
347 W Glenmore Dr Gretna, NE 68028
Estimated Value: $274,369 - $289,000
3
Beds
2
Baths
1,230
Sq Ft
$229/Sq Ft
Est. Value
About This Home
This home is located at 347 W Glenmore Dr, Gretna, NE 68028 and is currently estimated at $281,842, approximately $229 per square foot. 347 W Glenmore Dr is a home located in Sarpy County with nearby schools including Gretna Elementary School, Gretna Middle School, and Gretna High School.
Ownership History
Date
Name
Owned For
Owner Type
Purchase Details
Closed on
Feb 9, 2017
Sold by
Scheer Debbie S
Bought by
Scheer Ronny L
Current Estimated Value
Purchase Details
Closed on
Oct 18, 2016
Sold by
Kramer Michael T
Bought by
Scheer Ronny L
Purchase Details
Closed on
Sep 17, 2013
Sold by
Spurgeon David P and Spurgeon Kenneth
Bought by
Kramer Michael T
Home Financials for this Owner
Home Financials are based on the most recent Mortgage that was taken out on this home.
Original Mortgage
$117,600
Interest Rate
4.46%
Mortgage Type
New Conventional
Purchase Details
Closed on
Mar 2, 2013
Sold by
Jensen Kenneth William and Jensen Dorothy Louise
Bought by
Spurgeon David P and Spurgeon Kenneth
Purchase Details
Closed on
Dec 19, 2003
Sold by
Jensen Kenneth W and Jensen Dorothy L
Bought by
Jensen Kenneth William and Jensen Dorothy Louise
Create a Home Valuation Report for This Property
The Home Valuation Report is an in-depth analysis detailing your home's value as well as a comparison with similar homes in the area
Home Values in the Area
Average Home Value in this Area
Purchase History
| Date | Buyer | Sale Price | Title Company |
|---|---|---|---|
| Scheer Ronny L | -- | None Available | |
| Scheer Ronny L | $192,000 | Nebraska Title Company Om | |
| Kramer Michael T | $147,000 | Dakota Title & Escrow Co | |
| Spurgeon David P | -- | None Available | |
| Jensen Kenneth William | -- | -- |
Source: Public Records
Mortgage History
| Date | Status | Borrower | Loan Amount |
|---|---|---|---|
| Previous Owner | Kramer Michael T | $117,600 |
Source: Public Records
Tax History Compared to Growth
Tax History
| Year | Tax Paid | Tax Assessment Tax Assessment Total Assessment is a certain percentage of the fair market value that is determined by local assessors to be the total taxable value of land and additions on the property. | Land | Improvement |
|---|---|---|---|---|
| 2025 | $4,965 | $300,529 | $36,000 | $264,529 |
| 2024 | $5,221 | $276,018 | $33,000 | $243,018 |
| 2023 | $5,221 | $242,913 | $28,000 | $214,913 |
| 2022 | $5,036 | $220,696 | $26,000 | $194,696 |
| 2021 | $4,460 | $197,679 | $26,000 | $171,679 |
| 2020 | $3,999 | $178,261 | $26,000 | $152,261 |
| 2019 | $3,930 | $175,399 | $26,000 | $149,399 |
| 2018 | $3,826 | $171,529 | $19,000 | $152,529 |
| 2017 | $3,525 | $157,819 | $19,000 | $138,819 |
| 2016 | $3,401 | $152,664 | $19,000 | $133,664 |
| 2015 | $3,329 | $150,711 | $19,000 | $131,711 |
| 2014 | $3,304 | $150,840 | $19,000 | $131,840 |
| 2012 | -- | $150,577 | $19,000 | $131,577 |
Source: Public Records
Map
Nearby Homes
- 347 Michael Dr
- 710 Pawnee Dr
- 419 Highland Dr
- 213 Highland Dr
- Lot 127 W Gruenther Rd
- Lot 111 W Gruenther Rd
- TBD Lot 64 W Gruenther Rd
- 11303 S 210th Ave
- 20919 Mcclellan Cir
- Lot 136 W Gruenther Rd
- Lot 80 W Gruenther Rd
- Lot 71 W Gruenther Rd
- 206 E Westplains Rd
- 21111 Schofield Dr
- 21733 Parkview Dr
- 21710 Parkview Dr
- 21603 Parkview Dr
- 21719 Amber Dr
- 21715 Amber Dr
- 21906 Amber Dr
- 343 W Glenmore Dr
- 350 Michael Dr
- 339 W Glenmore Dr
- 346 Michael Dr
- 610 Pawnee Dr
- 346 W Glenmore Dr
- 342 Michael Dr
- 612 Pawnee Dr
- 342 W Glenmore Dr
- 518 Pawnee Dr
- 335 W Glenmore Dr
- 340 W Glenmore Dr
- 338 Michael Dr
- 614 Pawnee Dr
- 516 Pawnee Dr
- 334 W Glenmore Dr
- 329 W Glenmore Dr
- 334 Michael Dr
- 616 Pawnee Dr
- 607 Patrick Cir