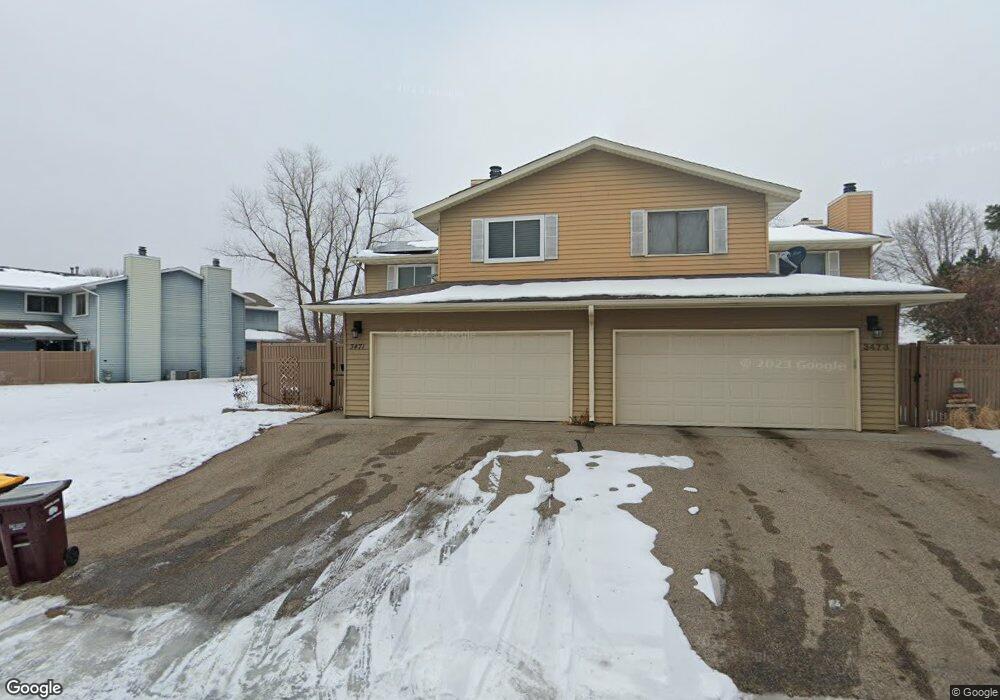
3471 Cloman Way Inver Grove Heights, MN 55076
Estimated Value: $224,000 - $238,000
2
Beds
1
Bath
1,256
Sq Ft
$183/Sq Ft
Est. Value
About This Home
This home is located at 3471 Cloman Way, Inver Grove Heights, MN 55076 and is currently estimated at $230,004, approximately $183 per square foot. 3471 Cloman Way is a home located in Dakota County with nearby schools including Hilltop Elementary School, Inver Grove Heights Middle School, and Simley Senior High School.
Ownership History
Date
Name
Owned For
Owner Type
Purchase Details
Closed on
Sep 18, 2020
Sold by
Brewer Angela and Brewer Michael
Bought by
Fanta Henok
Current Estimated Value
Home Financials for this Owner
Home Financials are based on the most recent Mortgage that was taken out on this home.
Original Mortgage
$200,305
Outstanding Balance
$177,428
Interest Rate
2.8%
Mortgage Type
New Conventional
Estimated Equity
$52,576
Purchase Details
Closed on
Dec 18, 2014
Sold by
Brewer Michael and Brewer Angela
Bought by
Brewer Michael and Brewer Angela
Home Financials for this Owner
Home Financials are based on the most recent Mortgage that was taken out on this home.
Original Mortgage
$108,000
Interest Rate
2.62%
Mortgage Type
Adjustable Rate Mortgage/ARM
Purchase Details
Closed on
Nov 19, 2003
Sold by
Kromschroeder Joseph H and Kromschroeder Jeri L
Bought by
Wood Angela
Create a Home Valuation Report for This Property
The Home Valuation Report is an in-depth analysis detailing your home's value as well as a comparison with similar homes in the area
Home Values in the Area
Average Home Value in this Area
Purchase History
| Date | Buyer | Sale Price | Title Company |
|---|---|---|---|
| Fanta Henok | $206,500 | The Title Group Inc | |
| Brewer Michael | -- | Land Title Inc | |
| Wood Angela | $154,000 | -- | |
| Kromschroeder Joseph B | $63,900 | -- |
Source: Public Records
Mortgage History
| Date | Status | Borrower | Loan Amount |
|---|---|---|---|
| Open | Fanta Henok | $200,305 | |
| Previous Owner | Brewer Michael | $108,000 |
Source: Public Records
Tax History Compared to Growth
Tax History
| Year | Tax Paid | Tax Assessment Tax Assessment Total Assessment is a certain percentage of the fair market value that is determined by local assessors to be the total taxable value of land and additions on the property. | Land | Improvement |
|---|---|---|---|---|
| 2024 | $1,980 | $199,400 | $29,700 | $169,700 |
| 2023 | $1,980 | $199,500 | $29,900 | $169,600 |
| 2022 | $1,736 | $197,700 | $29,800 | $167,900 |
| 2021 | $1,646 | $173,900 | $25,900 | $148,000 |
| 2020 | $1,798 | $163,900 | $24,700 | $139,200 |
| 2019 | $1,801 | $156,600 | $23,500 | $133,100 |
| 2018 | $1,672 | $145,900 | $21,800 | $124,100 |
| 2017 | $1,557 | $134,400 | $20,200 | $114,200 |
| 2016 | $1,462 | $122,800 | $19,200 | $103,600 |
| 2015 | $1,208 | $115,400 | $18,300 | $97,100 |
| 2014 | -- | $87,347 | $12,838 | $74,509 |
| 2013 | -- | $78,409 | $11,455 | $66,954 |
Source: Public Records
Map
Nearby Homes
- 3481 Cloman Way E
- 3548 Cloman Way
- 3568 Cloman Way
- 6445 Coryell Ct
- 6951 Clay Ave
- 3902 67th St E
- TBD 65th St E
- 7134 Claude Ave
- 7169 Clay Ave
- 4020 64th St E
- 6280 Carleda Way
- 7393 Clayton Ave
- 6050 Cahill Ave
- 6051 Concord Blvd
- 7344 Degrio Way
- 7602 Connie Ln
- 7614 Connie Ln
- 5938 Burke Trail
- Virginia Plan at Eagles Landing
- Cottonwood II Plan at Eagles Landing
- 3473 Cloman Way
- 3479 Cloman Way
- 3481 Cloman Way
- 3463 Cloman Way
- 3477 Cloman Way
- 3475 Cloman Way E
- 3461 Cloman Way
- 3475 Cloman Way
- 3483 Cloman Way
- 3484 Cloman Way
- 3485 Cloman Way
- 3450 Cloman Way
- 3448 Cloman Way Unit 78
- 3486 Cloman Way
- 3501 Cloman Way
- 3479 67th St E
- 3503 Cloman Way
- 3440 Cloman Way
- 3440 Cloman Way Unit 69
- 3488 Cloman Way