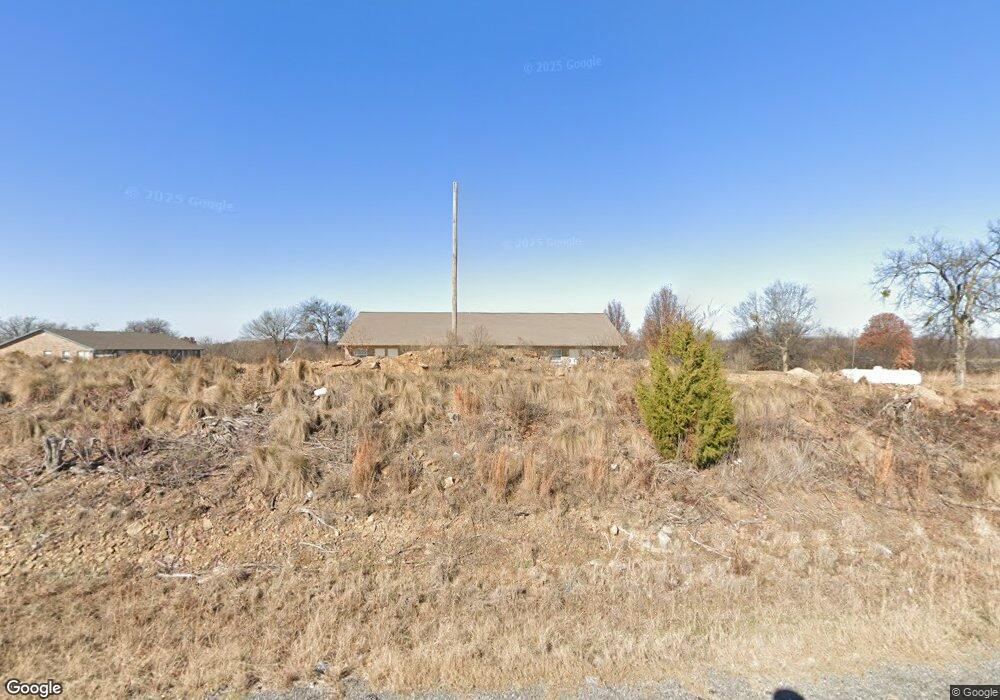
3471 State Highway 9a Eufaula, OK 74432
Estimated Value: $821,937
Studio
20
Baths
8,442
Sq Ft
$97/Sq Ft
Est. Value
About This Home
This home is located at 3471 State Highway 9a, Eufaula, OK 74432 and is currently estimated at $821,937, approximately $97 per square foot. 3471 State Highway 9a is a home located in Pittsburg County with nearby schools including Canadian Elementary School and Canadian High School.
Ownership History
Date
Name
Owned For
Owner Type
Purchase Details
Closed on
Oct 13, 2021
Sold by
Holman Keith and Holman Patricia
Bought by
G & B Investment Property Llc
Current Estimated Value
Home Financials for this Owner
Home Financials are based on the most recent Mortgage that was taken out on this home.
Original Mortgage
$82,250
Outstanding Balance
$68,975
Interest Rate
2.8%
Mortgage Type
Future Advance Clause Open End Mortgage
Estimated Equity
$752,962
Purchase Details
Closed on
Jan 7, 2005
Sold by
Willoby Don R and Willoby Kristi
Bought by
Holman Keith and Holman Patricia
Purchase Details
Closed on
Aug 10, 1999
Sold by
Remilliard John
Bought by
Willoby Don and Willoby Kristi
Purchase Details
Closed on
Feb 9, 1997
Sold by
Combs
Bought by
Remilliard
Purchase Details
Closed on
Jan 10, 1994
Sold by
Carey
Bought by
Combs
Create a Home Valuation Report for This Property
The Home Valuation Report is an in-depth analysis detailing your home's value as well as a comparison with similar homes in the area
Home Values in the Area
Average Home Value in this Area
Purchase History
| Date | Buyer | Sale Price | Title Company |
|---|---|---|---|
| G & B Investment Property Llc | $685,000 | None Available | |
| Holman Keith | $315,000 | None Available | |
| Willoby Don | $45,000 | -- | |
| Remilliard | $115,000 | -- | |
| Combs | $76,000 | -- |
Source: Public Records
Mortgage History
| Date | Status | Borrower | Loan Amount |
|---|---|---|---|
| Open | G & B Investment Property Llc | $82,250 |
Source: Public Records
Tax History
| Year | Tax Paid | Tax Assessment Tax Assessment Total Assessment is a certain percentage of the fair market value that is determined by local assessors to be the total taxable value of land and additions on the property. | Land | Improvement |
|---|---|---|---|---|
| 2025 | $5,803 | $75,099 | $4,950 | $70,149 |
| 2024 | $6,185 | $79,604 | $4,950 | $74,654 |
| 2023 | $5,909 | $75,813 | $4,950 | $70,863 |
| 2022 | $5,907 | $75,350 | $4,679 | $70,671 |
| 2021 | $6,289 | $79,699 | $4,950 | $74,749 |
| 2020 | $3,867 | $52,112 | $3,237 | $48,875 |
| 2019 | $3,683 | $52,112 | $3,237 | $48,875 |
| 2018 | $3,582 | $47,268 | $2,936 | $44,332 |
| 2017 | $3,417 | $45,016 | $3,313 | $41,703 |
| 2016 | $3,260 | $42,872 | $3,155 | $39,717 |
| 2015 | $3,118 | $40,831 | $7,854 | $32,977 |
| 2014 | $3,092 | $40,386 | $7,854 | $32,532 |
Source: Public Records
Map
Nearby Homes
- 3471 Oklahoma 9a
- 0 Bent Oak St Unit 2342290
- 0 Bent Oak St Unit 2319763
- 0 Bent Oak St Unit 1724628
- 0 Bent Oak St Unit 1747091
- 0 Bent Oak St Unit 1823561
- 0 Bent Oak St Unit 1901168
- 78 Bent Oak Ln
- 90 Bent Oak Ln
- 111 Bent Oak Ln
- 10 Bent Oak Ln
- 11 Bent Oak Ln
- 9 Bent Oak Ln
- 90 Krebs Ranch Rd
- 11 Hidden Creek Ct
- 11 Hidden Ct
- 243 Krebs Ranch Rd
- 130 Bent Oak Ln
- 12 Hidden Creek Ct
- 12 Hidden Ct
Your Personal Tour Guide
Ask me questions while you tour the home.