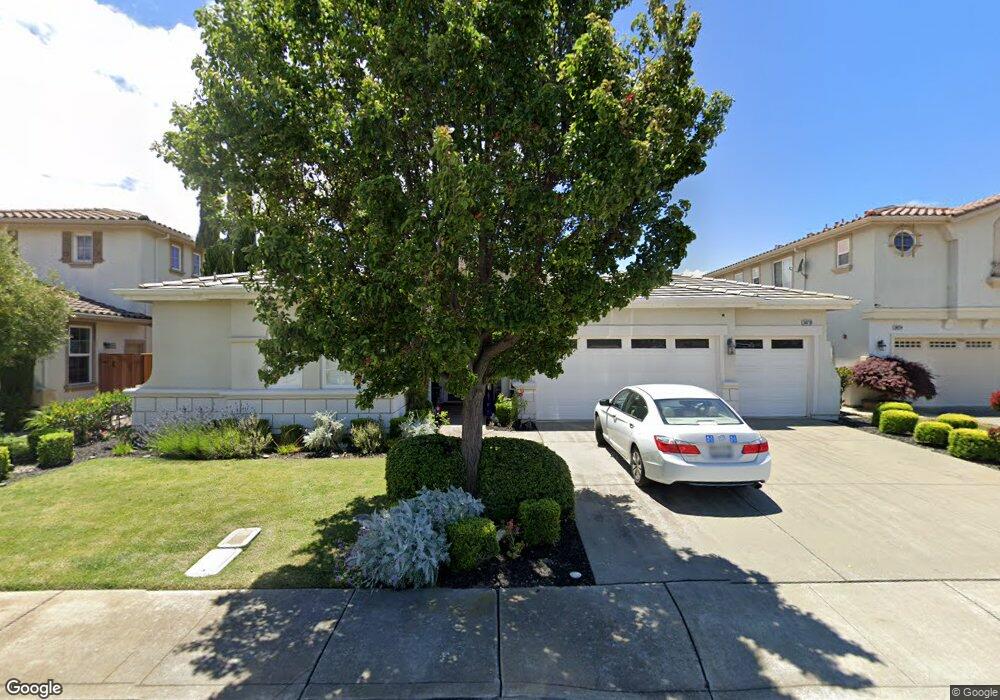
34718 Williams Way Union City, CA 94587
Alvarado NeighborhoodEstimated Value: $1,895,000 - $2,069,000
4
Beds
3
Baths
2,506
Sq Ft
$792/Sq Ft
Est. Value
About This Home
This home is located at 34718 Williams Way, Union City, CA 94587 and is currently estimated at $1,984,639, approximately $791 per square foot. 34718 Williams Way is a home located in Alameda County with nearby schools including Delaine Eastin Elementary School, Itliong-Vera Cruz, and James Logan High School.
Ownership History
Date
Name
Owned For
Owner Type
Purchase Details
Closed on
Oct 18, 2015
Sold by
Bayucan Albeaus R and Bayucan Maria Asuncion F
Bought by
The Bayucan Family Trust
Current Estimated Value
Purchase Details
Closed on
Apr 11, 2005
Sold by
Sousa Virginia and Virginia Sousa Declaration Of
Bought by
Bayucan Albeaus R and Bayucan Maria Asuncion F
Home Financials for this Owner
Home Financials are based on the most recent Mortgage that was taken out on this home.
Original Mortgage
$750,000
Outstanding Balance
$395,540
Interest Rate
6.12%
Mortgage Type
Purchase Money Mortgage
Estimated Equity
$1,589,099
Purchase Details
Closed on
Sep 18, 2002
Sold by
Sousa Virginia
Bought by
Sousa Virginia and The Virginia Sousa Declaration
Home Financials for this Owner
Home Financials are based on the most recent Mortgage that was taken out on this home.
Original Mortgage
$350,000
Interest Rate
6.6%
Purchase Details
Closed on
Jul 31, 2002
Sold by
Ponderosa Homes Ii Inc
Bought by
Sousa Virginia
Home Financials for this Owner
Home Financials are based on the most recent Mortgage that was taken out on this home.
Original Mortgage
$350,000
Interest Rate
6.6%
Create a Home Valuation Report for This Property
The Home Valuation Report is an in-depth analysis detailing your home's value as well as a comparison with similar homes in the area
Home Values in the Area
Average Home Value in this Area
Purchase History
| Date | Buyer | Sale Price | Title Company |
|---|---|---|---|
| The Bayucan Family Trust | -- | None Available | |
| Bayucan Albeaus R | $1,055,000 | Fidelity National Title Co | |
| Sousa Virginia | -- | -- | |
| Sousa Virginia | $760,000 | First American Title Guarant |
Source: Public Records
Mortgage History
| Date | Status | Borrower | Loan Amount |
|---|---|---|---|
| Open | Bayucan Albeaus R | $750,000 | |
| Previous Owner | Sousa Virginia | $350,000 | |
| Closed | Bayucan Albeaus R | $199,500 |
Source: Public Records
Tax History Compared to Growth
Tax History
| Year | Tax Paid | Tax Assessment Tax Assessment Total Assessment is a certain percentage of the fair market value that is determined by local assessors to be the total taxable value of land and additions on the property. | Land | Improvement |
|---|---|---|---|---|
| 2025 | $19,177 | $1,463,437 | $441,131 | $1,029,306 |
| 2024 | $19,177 | $1,434,614 | $432,484 | $1,009,130 |
| 2023 | $18,622 | $1,413,351 | $424,005 | $989,346 |
| 2022 | $18,412 | $1,378,647 | $415,694 | $969,953 |
| 2021 | $17,929 | $1,351,480 | $407,544 | $950,936 |
| 2020 | $17,858 | $1,344,554 | $403,366 | $941,188 |
| 2019 | $17,750 | $1,318,200 | $395,460 | $922,740 |
| 2018 | $17,331 | $1,292,364 | $387,709 | $904,655 |
| 2017 | $15,400 | $1,140,000 | $342,000 | $798,000 |
| 2016 | $15,283 | $1,135,000 | $340,500 | $794,500 |
| 2015 | $13,022 | $950,000 | $285,000 | $665,000 |
| 2014 | $11,572 | $857,000 | $257,100 | $599,900 |
Source: Public Records
Map
Nearby Homes
- 33025 Calistoga St
- 33024 Compton Ct
- 4852 Nadine Ct
- 32945 Regents Blvd
- 32461 Darlene Way
- 4639 Michelle Ct
- 4611 Carmen Way
- 32606 Singh Cir
- 32409 Elizabeth Way
- 34192 Firenze Terrace
- 5621 Via Lugano
- 34102 Zaner Way
- 4532 Delores Dr
- 4511 Martin St
- 34198 Tony Terrace
- 32447 Pacific Grove Way
- 6004 Pisa Terrace Unit 119
- 6003 Milano Terrace Unit 14
- 32425 Pacific Grove Way
- 32451 Regents Blvd
- 34714 Williams Way
- 34722 Williams Way
- 34726 Williams Way
- 34710 Williams Way
- 34727 Williams Way
- 5522 Alvelais Dr
- 34731 Williams Way
- 34730 Williams Way
- 5520 Alvelais Dr
- 34706 Williams Way
- 34735 Williams Way
- 5533 Alvelais Dr
- 34734 Williams Way
- 5529 Alvelais Dr
- 5518 Alvelais Dr
- 5318 Franco Ct
- 5313 Franco Ct
- 34739 Williams Way
- 5525 Alvelais Dr
- 34738 Williams Way