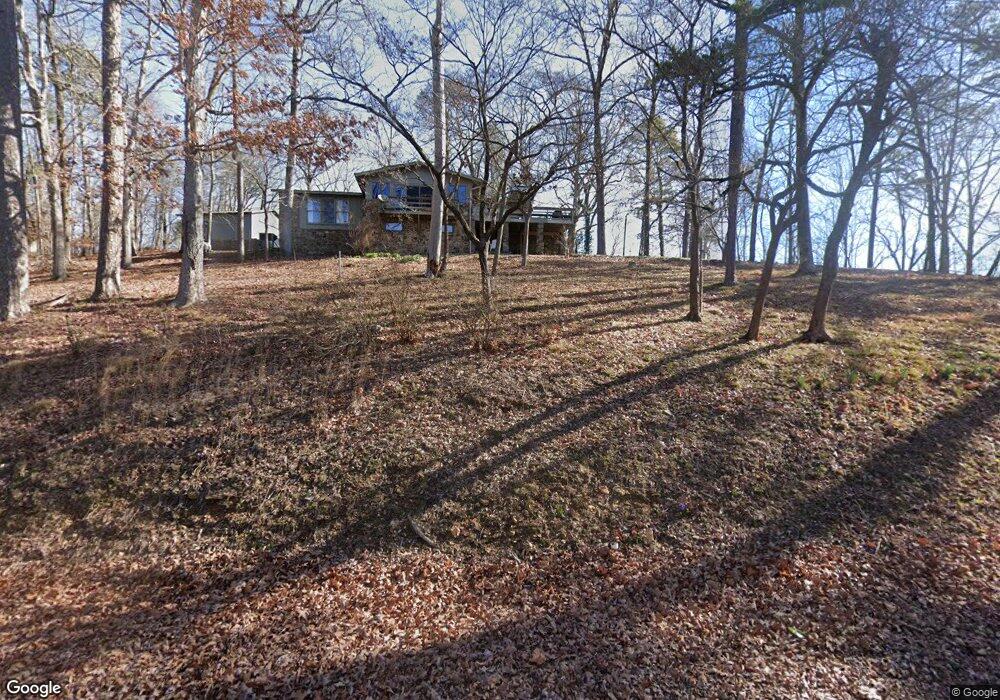
3475 Bruton Branch Rd Savannah, TN 38372
Estimated Value: $508,513 - $631,000
--
Bed
3
Baths
2,304
Sq Ft
$236/Sq Ft
Est. Value
About This Home
This home is located at 3475 Bruton Branch Rd, Savannah, TN 38372 and is currently estimated at $542,628, approximately $235 per square foot. 3475 Bruton Branch Rd is a home located in Hardin County with nearby schools including Hardin County High School.
Ownership History
Date
Name
Owned For
Owner Type
Purchase Details
Closed on
Jan 5, 2024
Sold by
Carter Family Trust
Bought by
Bibb John Richard and Bibb Benita Mae
Current Estimated Value
Home Financials for this Owner
Home Financials are based on the most recent Mortgage that was taken out on this home.
Original Mortgage
$451,250
Outstanding Balance
$443,847
Interest Rate
7.29%
Mortgage Type
Credit Line Revolving
Estimated Equity
$98,781
Purchase Details
Closed on
May 6, 2009
Sold by
Carter Don R
Bought by
Carter Family
Purchase Details
Closed on
Oct 12, 2001
Sold by
Peck Jerry W
Bought by
Holbert Ben
Purchase Details
Closed on
Jul 25, 1995
Sold by
Jordan Frank E and Jordan Celia C
Bought by
Carter Don R
Purchase Details
Closed on
Jul 15, 1991
Bought by
Jordan Frank E and Jordan Celia C
Purchase Details
Closed on
Jul 26, 1969
Bought by
Mcfall Henry A
Create a Home Valuation Report for This Property
The Home Valuation Report is an in-depth analysis detailing your home's value as well as a comparison with similar homes in the area
Home Values in the Area
Average Home Value in this Area
Purchase History
| Date | Buyer | Sale Price | Title Company |
|---|---|---|---|
| Bibb John Richard | -- | None Listed On Document | |
| Carter Family | -- | -- | |
| Holbert Ben | $244,500 | -- | |
| Carter Don R | $33,000 | -- | |
| Jordan Frank E | $140,000 | -- | |
| Mcfall Henry A | -- | -- |
Source: Public Records
Mortgage History
| Date | Status | Borrower | Loan Amount |
|---|---|---|---|
| Open | Bibb John Richard | $451,250 |
Source: Public Records
Tax History Compared to Growth
Tax History
| Year | Tax Paid | Tax Assessment Tax Assessment Total Assessment is a certain percentage of the fair market value that is determined by local assessors to be the total taxable value of land and additions on the property. | Land | Improvement |
|---|---|---|---|---|
| 2024 | $1,703 | $97,300 | $46,500 | $50,800 |
| 2023 | $1,703 | $97,300 | $46,500 | $50,800 |
| 2022 | $1,628 | $79,050 | $46,500 | $32,550 |
| 2021 | $1,628 | $79,050 | $46,500 | $32,550 |
| 2020 | $1,628 | $79,050 | $46,500 | $32,550 |
| 2019 | $1,628 | $79,050 | $46,500 | $32,550 |
| 2018 | $1,574 | $79,050 | $46,500 | $32,550 |
| 2017 | $1,112 | $53,475 | $25,000 | $28,475 |
| 2016 | $1,112 | $53,475 | $25,000 | $28,475 |
| 2015 | $973 | $53,475 | $25,000 | $28,475 |
| 2014 | $973 | $53,475 | $25,000 | $28,475 |
Source: Public Records
Map
Nearby Homes
- 140 Huckleberry Ln
- 65 Huckleberry Ln
- 2125 Bruton Branch Rd
- 1405 Bruton Branch Rd
- 24 Bruton Branch Rd
- 00 Fox Ln
- 240 Breathtaking Loop
- LOT 212 Preserve Hideaway Plan Blvd
- LOT 14 Breathtaking Loop
- 44 Breathtaking Loop
- 43 Breathtaking Loop
- LOT 212 Preserve Willow Plan Blvd
- 1 Lakeway Ln
- LOT 256 Stone Hill Loop
- LOT 257 Stone Hill Loop
- 200 Pioneer Ln
- 200 Pioneer Trail
- 160 Dolores Cove
- 540 Breathtaking Loop
- LOT 274 & 275 Secluded Loop
- 3470 Bruton Branch Rd
- 3395 Bruton Branch Rd
- 3525 Bruton Branch Rd
- 3500 Bruton Branch Rd
- 3420 Bruton Branch Rd
- 3385 Bruton Branch Rd
- 3530 Bruton Branch Rd
- 3380 Bruton Branch Rd
- 3520 Bruton Branch Rd
- 3350 Bruton Branch Rd
- 3340 Bruton Branch Rd
- 497 Huckleberry Ln
- 500 Huckleberry Ln
- 490 Huckleberry Ln
- 3280 Bruton Branch Rd
- 460 Huckleberry Ln
- 455 Huckleberry Ln
- 3250 Bruton Branch Rd
- 425 Huckleberry Ln
- 3220 Bruton Branch Rd