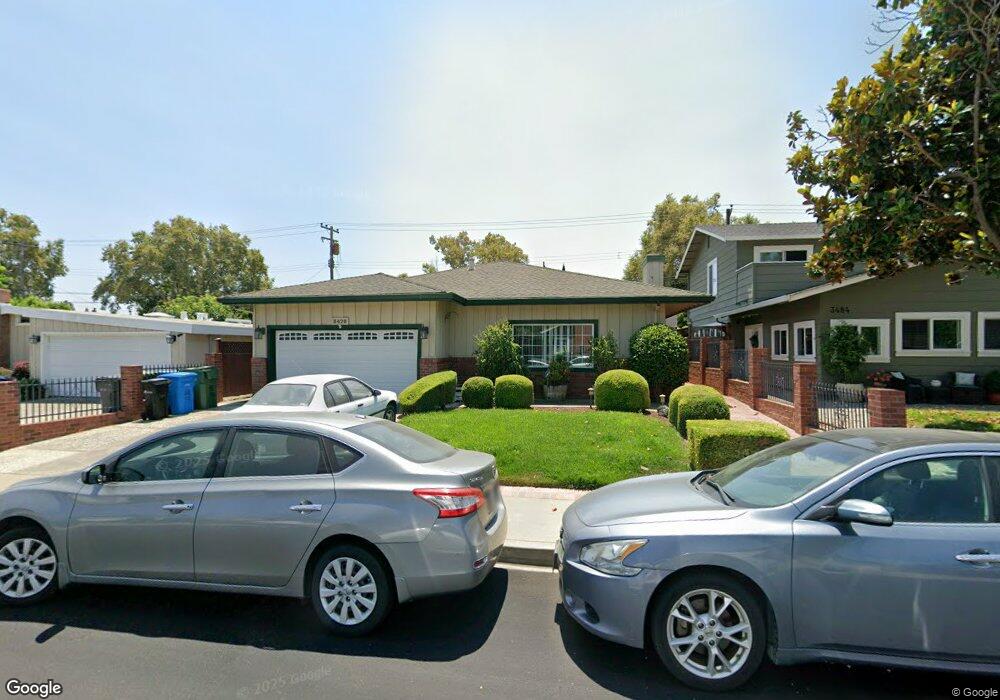
3478 Shafer Dr Santa Clara, CA 95051
Estimated Value: $1,884,000 - $2,040,000
3
Beds
2
Baths
1,517
Sq Ft
$1,285/Sq Ft
Est. Value
About This Home
This home is located at 3478 Shafer Dr, Santa Clara, CA 95051 and is currently estimated at $1,949,510, approximately $1,285 per square foot. 3478 Shafer Dr is a home located in Santa Clara County with nearby schools including Pomeroy Elementary School, Juan Cabrillo Middle School, and Santa Clara High School.
Ownership History
Date
Name
Owned For
Owner Type
Purchase Details
Closed on
May 6, 2010
Sold by
Kavanagh Bernard
Bought by
Malekmohammadi Nazila
Current Estimated Value
Home Financials for this Owner
Home Financials are based on the most recent Mortgage that was taken out on this home.
Original Mortgage
$350,000
Outstanding Balance
$234,476
Interest Rate
5.04%
Mortgage Type
New Conventional
Estimated Equity
$1,715,034
Purchase Details
Closed on
Feb 3, 2005
Sold by
Kavanagh Bernard N
Bought by
Kavanagh Bernard
Home Financials for this Owner
Home Financials are based on the most recent Mortgage that was taken out on this home.
Original Mortgage
$300,000
Interest Rate
5%
Mortgage Type
New Conventional
Purchase Details
Closed on
May 25, 2004
Sold by
Kavanagh Bernard N
Bought by
Kavanagh Bernard N
Purchase Details
Closed on
Dec 29, 1997
Sold by
Marie Kimball Rose
Bought by
Kimball Rose M
Purchase Details
Closed on
May 11, 1995
Sold by
Bertelmann Rose Marie and Kimball Rose Marie
Bought by
Kimball Rose Marie and Kimball Eugene L
Create a Home Valuation Report for This Property
The Home Valuation Report is an in-depth analysis detailing your home's value as well as a comparison with similar homes in the area
Home Values in the Area
Average Home Value in this Area
Purchase History
| Date | Buyer | Sale Price | Title Company |
|---|---|---|---|
| Malekmohammadi Nazila | $650,000 | Chicago Title Company | |
| Kavanagh Bernard | -- | Chicago Title | |
| Kavanagh Bernard N | -- | -- | |
| Kimball Rose M | -- | -- | |
| Kimball Rose Marie | -- | -- |
Source: Public Records
Mortgage History
| Date | Status | Borrower | Loan Amount |
|---|---|---|---|
| Open | Malekmohammadi Nazila | $350,000 | |
| Previous Owner | Kavanagh Bernard | $300,000 |
Source: Public Records
Tax History Compared to Growth
Tax History
| Year | Tax Paid | Tax Assessment Tax Assessment Total Assessment is a certain percentage of the fair market value that is determined by local assessors to be the total taxable value of land and additions on the property. | Land | Improvement |
|---|---|---|---|---|
| 2025 | $9,616 | $839,018 | $629,268 | $209,750 |
| 2024 | $9,616 | $822,568 | $616,930 | $205,638 |
| 2023 | $9,518 | $806,440 | $604,834 | $201,606 |
| 2022 | $9,358 | $790,628 | $592,975 | $197,653 |
| 2021 | $9,319 | $775,127 | $581,349 | $193,778 |
| 2020 | $9,149 | $767,180 | $575,388 | $191,792 |
| 2019 | $9,136 | $752,138 | $564,106 | $188,032 |
| 2018 | $8,548 | $737,392 | $553,046 | $184,346 |
| 2017 | $8,505 | $722,934 | $542,202 | $180,732 |
| 2016 | $8,330 | $708,760 | $531,571 | $177,189 |
| 2015 | $8,297 | $698,115 | $523,587 | $174,528 |
| 2014 | $7,883 | $684,441 | $513,331 | $171,110 |
Source: Public Records
Map
Nearby Homes
- 836 Pomeroy Ave Unit 70
- 840 Quince Ave Unit 27
- 834 Quince Ave Unit 37
- 3033 Kaiser Dr Unit H
- 1496 Mcpherson St
- 1545 Pomeroy Ave
- 1155 London Ave
- 960 Kiely Blvd Unit F
- 1014 Teal Dr
- 1661 Nobili Ave
- 940 Kiely Blvd Unit H
- 1105 Lorne Way
- 986 Kiely Blvd Unit D
- 3513 Oxford Ct
- 3089 El Camino Real Unit 9
- 3089 El Camino Real Unit 7
- 3089 El Camino Real Unit 5
- 3089 El Camino Real Unit 11
- 3079 El Camino Real Unit 101
- 3079 El Camino Real Unit 205
- 3474 Shafer Dr
- 3484 Shafer Dr
- 3468 Shafer Dr
- 3488 Shafer Dr
- 3483 Golden State Dr
- 3477 Golden State Dr
- 3487 Golden State Dr
- 3473 Golden State Dr
- 3475 Shafer Dr
- 3481 Shafer Dr
- 3464 Shafer Dr
- 3494 Shafer Dr
- 3493 Golden State Dr
- 3471 Shafer Dr
- 3467 Golden State Dr
- 3485 Shafer Dr
- 3465 Shafer Dr
- 3491 Shafer Dr
- 3498 Shafer Dr
- 3497 Golden State Dr