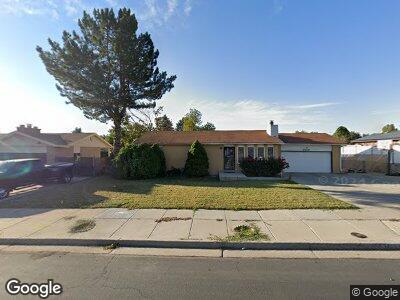
3479 Charing Cross Rd West Jordan, UT 84084
Estimated Value: $513,000 - $566,000
5
Beds
3
Baths
2,814
Sq Ft
$195/Sq Ft
Est. Value
About This Home
This home is located at 3479 Charing Cross Rd, West Jordan, UT 84084 and is currently estimated at $547,507, approximately $194 per square foot. 3479 Charing Cross Rd is a home located in Salt Lake County with nearby schools including Oquirrh Elementary School, Joel P. Jensen Middle School, and West Jordan High School.
Ownership History
Date
Name
Owned For
Owner Type
Purchase Details
Closed on
Aug 11, 2016
Sold by
Castelan Vannessa and Ghandian Vannessa
Bought by
Ghandian Vannessa and Ghandian Kiya
Current Estimated Value
Purchase Details
Closed on
Jun 1, 2016
Sold by
Castelan Vannessa and Castelan Debbie
Bought by
Castelan Vanessa and Ghandian Kiyan
Home Financials for this Owner
Home Financials are based on the most recent Mortgage that was taken out on this home.
Original Mortgage
$209,200
Interest Rate
3.59%
Mortgage Type
New Conventional
Purchase Details
Closed on
Aug 28, 2014
Sold by
Rodriguez Ernie
Bought by
Castelan Vannessa and Ghandian Debbie
Home Financials for this Owner
Home Financials are based on the most recent Mortgage that was taken out on this home.
Original Mortgage
$208,454
Interest Rate
3.62%
Mortgage Type
FHA
Create a Home Valuation Report for This Property
The Home Valuation Report is an in-depth analysis detailing your home's value as well as a comparison with similar homes in the area
Home Values in the Area
Average Home Value in this Area
Purchase History
| Date | Buyer | Sale Price | Title Company |
|---|---|---|---|
| Ghandian Vannessa | -- | Stewart Title Ins Agcy Of Ut | |
| Castelan Vanessa | -- | Stewart Title Ins Agcy Of Ut | |
| Castelan Vannessa | -- | Backman Title Services |
Source: Public Records
Mortgage History
| Date | Status | Borrower | Loan Amount |
|---|---|---|---|
| Open | Ghandian Vannessa | $80,000 | |
| Open | Ghandian Vannessa | $219,500 | |
| Closed | Ghandian Vannessa | $77,000 | |
| Closed | Castelan Vanessa | $209,200 | |
| Closed | Castelan Vannessa | $208,454 |
Source: Public Records
Tax History Compared to Growth
Tax History
| Year | Tax Paid | Tax Assessment Tax Assessment Total Assessment is a certain percentage of the fair market value that is determined by local assessors to be the total taxable value of land and additions on the property. | Land | Improvement |
|---|---|---|---|---|
| 2023 | $2,386 | $432,700 | $118,500 | $314,200 |
| 2022 | $2,484 | $443,100 | $116,200 | $326,900 |
| 2021 | $2,084 | $338,400 | $91,900 | $246,500 |
| 2020 | $1,932 | $294,400 | $85,900 | $208,500 |
| 2019 | $1,943 | $290,400 | $85,900 | $204,500 |
| 2018 | $1,761 | $261,000 | $81,100 | $179,900 |
| 2017 | $1,643 | $242,500 | $81,100 | $161,400 |
| 2016 | $1,589 | $220,300 | $81,100 | $139,200 |
| 2015 | $1,569 | $212,100 | $82,700 | $129,400 |
| 2014 | $1,504 | $200,200 | $78,800 | $121,400 |
Source: Public Records
Map
Nearby Homes
- 3529 W 7580 S
- 7548 S 3270 W
- 3262 W Charing Cross Rd
- 5682 W New World Dr
- 3354 W 7800 S
- 3429 W Beckford Cir
- 3437 W Sunrise Cir
- 3629 W 7825 S
- 2842 W 7550 S
- 3383 W 6880 S
- 8008 S Lismore Ln
- 3683 W Atlanta Cir
- 3262 W 6920 S
- 3500 W 6875 S
- 3559 W Lexington View Dr
- 6852 S 3370 W
- 7124 S Rocky Trail Unit 104
- 2311 W Hidden Trail Cove Cove Unit 118
- 7947 Linton Dr
- 6828 S Georgia Dr
- 3479 Charing Cross Rd
- 7457 Woodgreen Rd
- 3467 Charing Cross Rd
- 3480 Fenchurch Rd
- 3470 Fenchurch Rd
- 7469 Woodgreen Rd
- 3480 Charing Cross Rd
- 3455 Charing Cross Rd
- 3468 Charing Cross Rd
- 3490 Charing Cross Rd
- 3458 Fenchurch Rd
- 7456 Woodgreen Rd
- 3456 Charing Cross Rd
- 3456 W Charing Cross Rd
- 3512 Fenchurch Rd
- 3512 W Fenchurch Rd
- 7458 Bromley Rd
- 3479 W Fenchurch Rd
- 3479 Fenchurch Rd
- 7468 Bromley Rd