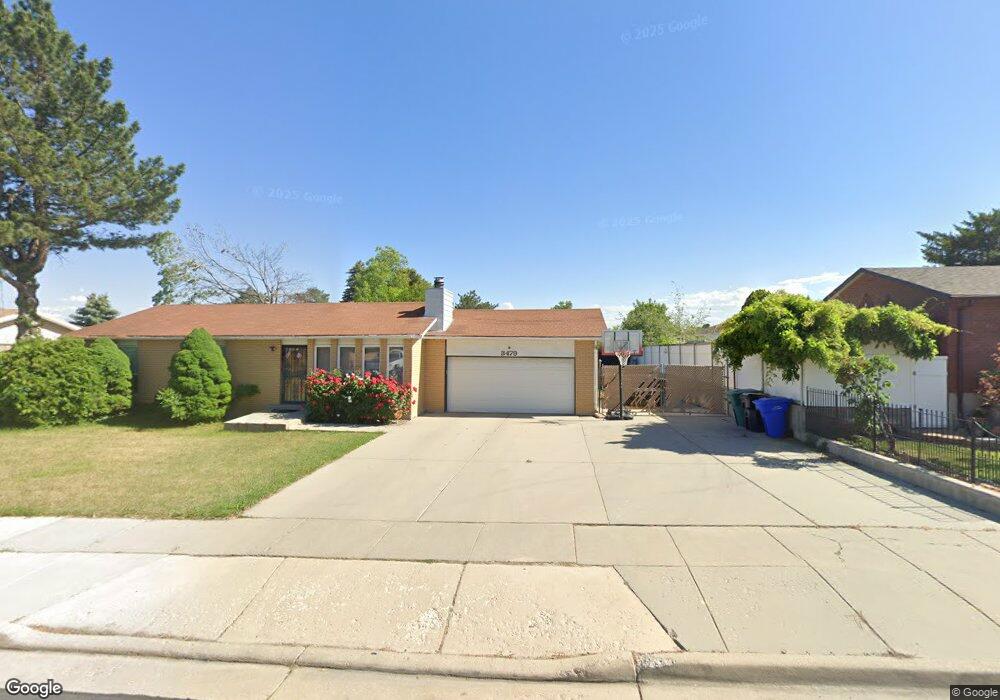
3479 Fenchurch Rd West Jordan, UT 84084
Estimated Value: $513,000 - $567,000
4
Beds
3
Baths
1,204
Sq Ft
$455/Sq Ft
Est. Value
About This Home
This home is located at 3479 Fenchurch Rd, West Jordan, UT 84084 and is currently estimated at $547,585, approximately $454 per square foot. 3479 Fenchurch Rd is a home located in Salt Lake County with nearby schools including Oquirrh Elementary School, Joel P. Jensen Middle School, and West Jordan High School.
Ownership History
Date
Name
Owned For
Owner Type
Purchase Details
Closed on
Jan 24, 2011
Sold by
Oreilly Richard N
Bought by
Oreilly Richard N and Oreilly Laree Coleen
Current Estimated Value
Purchase Details
Closed on
Jun 27, 1996
Sold by
Francis Judy
Bought by
Ketten Theodore L and Ketten Jackie G
Purchase Details
Closed on
Oct 19, 1995
Sold by
Francis Reed F and Francis Leslie L
Bought by
Francis Judy
Purchase Details
Closed on
Dec 17, 1993
Sold by
Francis Reed Ferguson
Bought by
Francis Judy and Francis Reed F
Create a Home Valuation Report for This Property
The Home Valuation Report is an in-depth analysis detailing your home's value as well as a comparison with similar homes in the area
Home Values in the Area
Average Home Value in this Area
Purchase History
| Date | Buyer | Sale Price | Title Company |
|---|---|---|---|
| Oreilly Richard N | -- | Accommodation | |
| Oreilly Richard N | -- | Accommodation | |
| Ketten Theodore L | -- | -- | |
| Ketten Theodore L | -- | -- | |
| Francis Judy | -- | -- | |
| Francis Judy | -- | -- | |
| Francis Judy | -- | -- | |
| Francis Judy | -- | -- |
Source: Public Records
Tax History Compared to Growth
Tax History
| Year | Tax Paid | Tax Assessment Tax Assessment Total Assessment is a certain percentage of the fair market value that is determined by local assessors to be the total taxable value of land and additions on the property. | Land | Improvement |
|---|---|---|---|---|
| 2025 | $2,722 | $540,600 | $128,600 | $412,000 |
| 2024 | $2,722 | $523,700 | $124,300 | $399,400 |
| 2023 | $2,531 | $458,900 | $119,500 | $339,400 |
| 2022 | $2,638 | $470,600 | $117,200 | $353,400 |
| 2021 | $2,217 | $360,000 | $92,700 | $267,300 |
| 2020 | $2,073 | $316,000 | $86,600 | $229,400 |
| 2019 | $2,096 | $313,200 | $86,600 | $226,600 |
| 2018 | $1,882 | $278,900 | $81,800 | $197,100 |
| 2017 | $1,750 | $258,300 | $81,800 | $176,500 |
| 2016 | $1,708 | $236,800 | $81,800 | $155,000 |
| 2015 | $1,718 | $232,300 | $83,400 | $148,900 |
| 2014 | $1,645 | $219,000 | $79,500 | $139,500 |
Source: Public Records
Map
Nearby Homes
- 3422 Briar Dr
- 7611 S Springbrook Dr
- 3354 W 7800 S
- 7604 S Autumn Dr
- 7122 S Wood Green Rd
- 3629 W 7825 S
- 3165 W 7720 S
- 3476 W Spaulding Rd
- 3647 W 7865 S
- 2886 W 7550 S
- 3546 W 7980 S
- 6980 S 3535 W Unit 2
- 6968 S 3535 W Unit 3
- 3066 W Linton Dr
- 7989 S 3725 W
- 6992 W Terraine Rd
- 7721 Sunset Cir
- 7991 S 3725 W
- 8058 S Lismore Ln Unit 304
- 6978 W Terraine Rd
- 3479 W Fenchurch Rd
- 7491 Woodgreen Rd
- 3469 Fenchurch Rd
- 7511 S Wood Green Rd
- 3488 W 7520 S
- 3464 W 7520 S
- 7511 S Woodgreen Rd
- 3480 Fenchurch Rd
- 3457 Fenchurch Rd
- 3470 Fenchurch Rd
- 7469 Woodgreen Rd
- 3452 W 7520 S
- 7492 Woodgreen Rd
- 7492 S Woodgreen Rd
- 3458 Fenchurch Rd
- 7503 S Wood Green Rd
- 7503 Woodgreen Rd
- 3431 Fenchurch Rd
- 3485 W 7520 S
- 3479 Charing Cross Rd