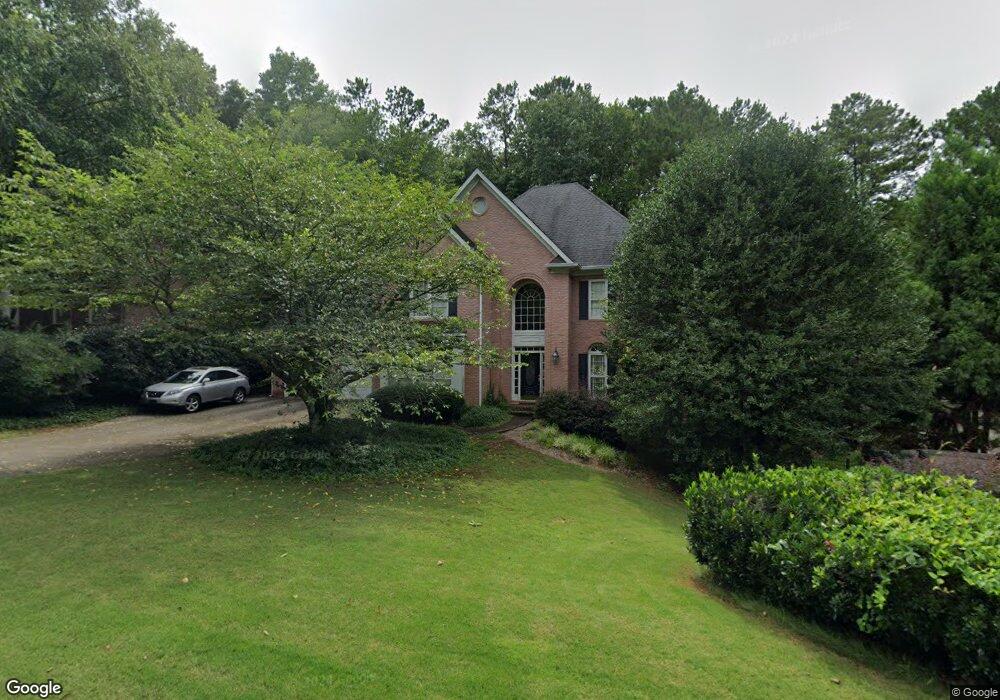
3479 Mill Bridge Dr Unit 2 Marietta, GA 30062
East Cobb NeighborhoodEstimated Value: $654,000 - $1,045,000
5
Beds
5
Baths
3,538
Sq Ft
$252/Sq Ft
Est. Value
About This Home
This home is located at 3479 Mill Bridge Dr Unit 2, Marietta, GA 30062 and is currently estimated at $890,560, approximately $251 per square foot. 3479 Mill Bridge Dr Unit 2 is a home located in Cobb County with nearby schools including East Side Elementary School, Dodgen Middle School, and Walton High School.
Ownership History
Date
Name
Owned For
Owner Type
Purchase Details
Closed on
Aug 3, 2010
Sold by
Chu Tom and Chu Amy
Bought by
Chu Amy
Current Estimated Value
Purchase Details
Closed on
Dec 7, 2006
Sold by
Hochstein Patrick R and Hochstein Brenda
Bought by
Chu Tom and Chu Amy
Home Financials for this Owner
Home Financials are based on the most recent Mortgage that was taken out on this home.
Original Mortgage
$407,920
Interest Rate
6.29%
Mortgage Type
New Conventional
Purchase Details
Closed on
Feb 26, 1999
Sold by
Marrache Marcus K and Marrache Rebecca G
Bought by
Hookstein Patrick R and Hookstein Bren
Home Financials for this Owner
Home Financials are based on the most recent Mortgage that was taken out on this home.
Original Mortgage
$275,200
Interest Rate
6.74%
Mortgage Type
New Conventional
Create a Home Valuation Report for This Property
The Home Valuation Report is an in-depth analysis detailing your home's value as well as a comparison with similar homes in the area
Home Values in the Area
Average Home Value in this Area
Purchase History
| Date | Buyer | Sale Price | Title Company |
|---|---|---|---|
| Chu Amy | -- | -- | |
| Chu Tom | $509,900 | -- | |
| Hookstein Patrick R | $344,000 | -- |
Source: Public Records
Mortgage History
| Date | Status | Borrower | Loan Amount |
|---|---|---|---|
| Previous Owner | Chu Tom | $407,920 | |
| Previous Owner | Hookstein Patrick R | $275,200 |
Source: Public Records
Tax History Compared to Growth
Tax History
| Year | Tax Paid | Tax Assessment Tax Assessment Total Assessment is a certain percentage of the fair market value that is determined by local assessors to be the total taxable value of land and additions on the property. | Land | Improvement |
|---|---|---|---|---|
| 2025 | $8,826 | $353,296 | $80,000 | $273,296 |
| 2024 | $8,316 | $329,456 | $72,000 | $257,456 |
| 2023 | $6,651 | $277,712 | $58,000 | $219,712 |
| 2022 | $7,247 | $277,712 | $58,000 | $219,712 |
| 2021 | $6,184 | $229,152 | $58,000 | $171,152 |
| 2020 | $6,184 | $229,152 | $58,000 | $171,152 |
| 2019 | $6,184 | $229,152 | $58,000 | $171,152 |
| 2018 | $6,184 | $229,152 | $58,000 | $171,152 |
| 2017 | $5,388 | $204,296 | $55,200 | $149,096 |
| 2016 | $5,392 | $204,296 | $55,200 | $149,096 |
| 2015 | $5,517 | $204,296 | $55,200 | $149,096 |
| 2014 | $5,559 | $204,296 | $0 | $0 |
Source: Public Records
Map
Nearby Homes
- 3495 Mill Bridge Dr Unit 2
- 3402 Devoe Ct
- 3218 Holly Mill Run
- 2041 Kramer Way
- 3292 Holly Mill Ct
- 3246 Able Ct
- 1680 Bill Murdock Rd
- 1942 Hunters Bend Ct
- 3825 Emerson St
- 3650 Oak Ln
- 3025 Bunker Hill Cir
- 718 Trevett Way
- 3570 Brighton Place
- 2268 Woodsfield Ln NE
- 1771 Canton Hills Cir
- 2988 Nestle Creek Dr
- 1257 Independence Way
- 3481 Mill Bridge Dr
- 3477 Mill Bridge Dr
- 1800 Newstead Trace
- 1802 Newstead Trace
- 3483 Mill Bridge Dr
- 1710 Barrington Cir
- 3480 Mill Bridge Dr
- 3480 Mill Bridge Dr
- 3480 Mill Bridge Dr Unit 2
- 3475 Mill Bridge Dr
- 3474 Mill Bridge Dr
- 3486 Mill Bridge Dr Unit 2
- 1713 Barrington Cir
- 1715 Barrington Cir
- 3473 Mill Bridge Dr Unit 2
- 1766 Barrington Cir
- 1708 Barrington Cir
- 1804 Newstead Trace
- 3485 Mill Bridge Dr
- 1801 Newstead Trace