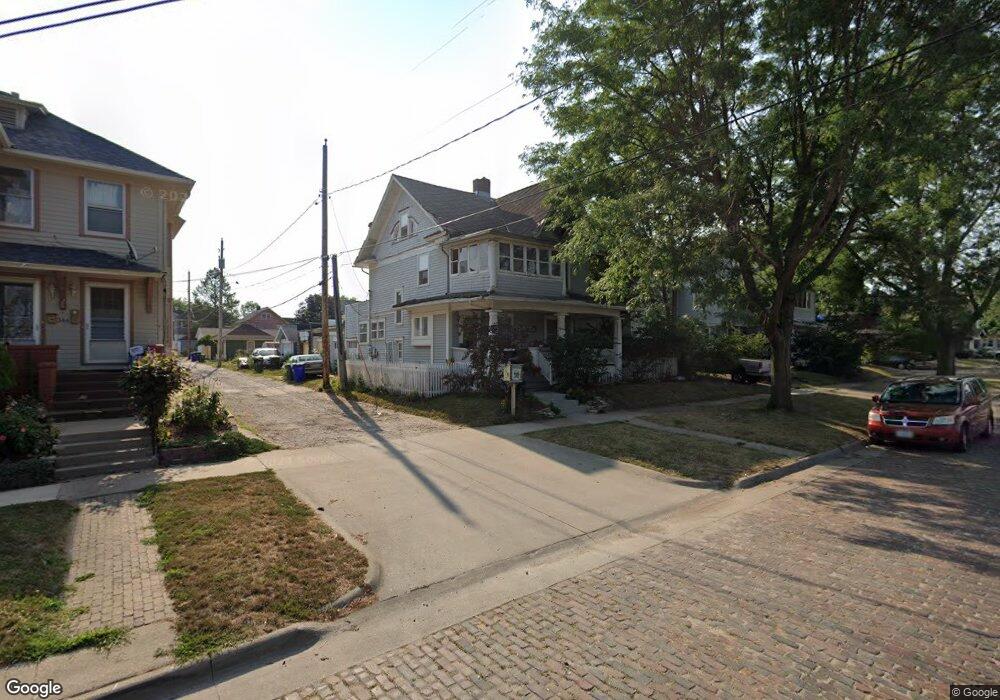
348 16th St SE Cedar Rapids, IA 52403
Wellington Heights NeighborhoodEstimated Value: $113,000 - $145,000
5
Beds
2
Baths
1,611
Sq Ft
$80/Sq Ft
Est. Value
About This Home
This home is located at 348 16th St SE, Cedar Rapids, IA 52403 and is currently estimated at $128,980, approximately $80 per square foot. 348 16th St SE is a home located in Linn County with nearby schools including Johnson STEAM Academy, McKinley STEAM Academy, and George Washington High School.
Ownership History
Date
Name
Owned For
Owner Type
Purchase Details
Closed on
Nov 12, 2010
Sold by
Secretary Of Veterans Afffairs
Bought by
Staab Len D and Staab Kay E
Current Estimated Value
Home Financials for this Owner
Home Financials are based on the most recent Mortgage that was taken out on this home.
Original Mortgage
$39,000
Interest Rate
4.53%
Mortgage Type
Purchase Money Mortgage
Purchase Details
Closed on
Aug 10, 2010
Sold by
Wells Fargo Bank Na
Bought by
Secretary Of Veterans Affairs
Purchase Details
Closed on
Jul 13, 2010
Sold by
Kazberouk Vladimir E and Kazberouk Rebecca R
Bought by
Wells Fargo Bank Na
Purchase Details
Closed on
Jun 17, 2005
Sold by
Broadstone Craig and Broadstone Rosie
Bought by
Schaul Peter A
Home Financials for this Owner
Home Financials are based on the most recent Mortgage that was taken out on this home.
Original Mortgage
$77,050
Interest Rate
5.69%
Mortgage Type
VA
Create a Home Valuation Report for This Property
The Home Valuation Report is an in-depth analysis detailing your home's value as well as a comparison with similar homes in the area
Home Values in the Area
Average Home Value in this Area
Purchase History
| Date | Buyer | Sale Price | Title Company |
|---|---|---|---|
| Staab Len D | $40,000 | None Available | |
| Secretary Of Veterans Affairs | -- | None Available | |
| Wells Fargo Bank Na | $33,930 | None Available | |
| Schaul Peter A | -- | -- | |
| Kazberouk Vladimir E | $84,500 | -- |
Source: Public Records
Mortgage History
| Date | Status | Borrower | Loan Amount |
|---|---|---|---|
| Previous Owner | Staab Len D | $39,000 | |
| Previous Owner | Kazberouk Vladimir E | $77,050 |
Source: Public Records
Tax History Compared to Growth
Tax History
| Year | Tax Paid | Tax Assessment Tax Assessment Total Assessment is a certain percentage of the fair market value that is determined by local assessors to be the total taxable value of land and additions on the property. | Land | Improvement |
|---|---|---|---|---|
| 2025 | $1,674 | $112,800 | $22,800 | $90,000 |
| 2024 | $1,844 | $107,300 | $20,100 | $87,200 |
| 2023 | $1,844 | $94,600 | $17,300 | $77,300 |
| 2022 | $1,610 | $87,400 | $17,300 | $70,100 |
| 2021 | $1,652 | $77,700 | $14,600 | $63,100 |
| 2020 | $1,652 | $74,900 | $14,600 | $60,300 |
| 2019 | $1,550 | $71,900 | $12,800 | $59,100 |
| 2018 | $1,508 | $71,900 | $12,800 | $59,100 |
| 2017 | $1,604 | $73,700 | $12,800 | $60,900 |
| 2016 | $1,566 | $73,700 | $12,800 | $60,900 |
| 2015 | $1,572 | $73,861 | $12,775 | $61,086 |
| 2014 | $1,572 | $73,861 | $12,775 | $61,086 |
| 2013 | $1,538 | $73,861 | $12,775 | $61,086 |
Source: Public Records
Map
Nearby Homes
- 356 16th St SE
- 1519 Park Ave SE
- 210 16th St SE
- 1730 Park Ave SE
- 1514 3rd Ave SE
- 1711 Blake Blvd SE
- 1727 Grande Ave SE
- 1517 2nd Ave SE
- 1628 2nd Ave SE
- 1816 Park Ave SE
- 1559 Bever Ave SE
- 1801 Blake Blvd SE
- 369 15th St SE
- 1416 3rd Ave SE
- 1815 Washington Ave SE
- 1830 Grande Ave SE
- 361 19th St SE
- 1613 A Ave NE
- 1821 Ridgewood Terrace SE
- 116 17th St NE
- 344 16th St SE
- 1606 Park Ave SE
- 1602 Park Ave SE
- 1610 Park Ave SE
- 1614 Park Ave SE
- 1609 Grande Ave SE
- 1601 Grande Ave SE
- 1611 Grande Ave SE
- 1620 Park Ave SE
- 1615 Grande Ave SE
- 1628 Park Ave SE
- 1619 Grande Ave SE
- 1601 Park Ave SE
- 1630 Park Ave SE
- 1559 Park Ave SE
- 1609 Park Ave SE
- 1625 Grande Ave SE
- 1611 Park Ave SE
- 1557 Park Ave SE
- 351 17th St SE