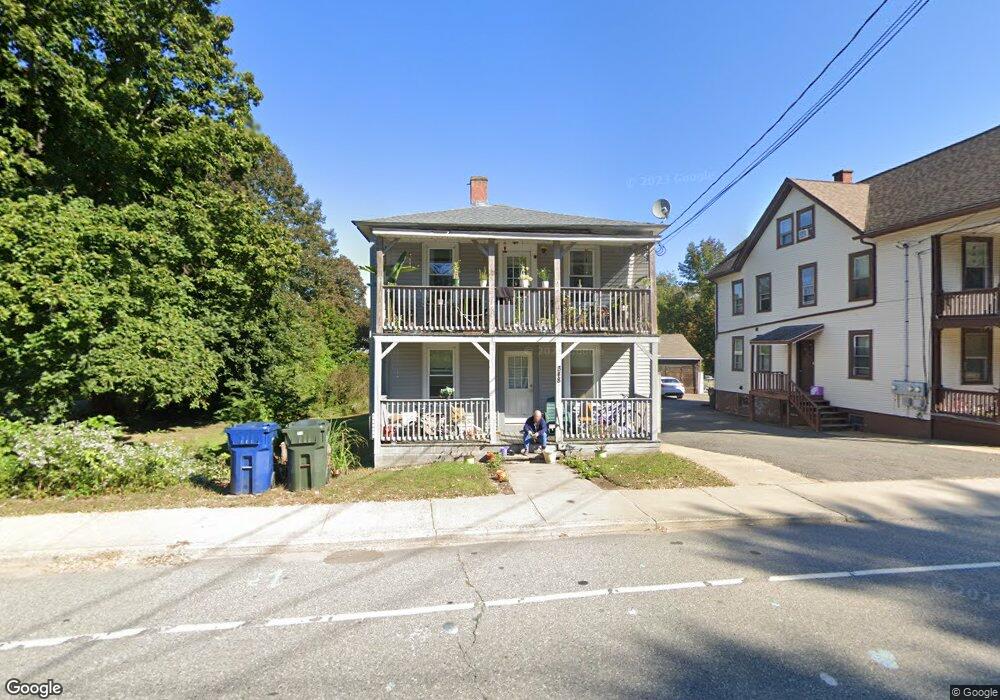
348 Brick Top Rd Windham, CT 06280
Estimated Value: $264,573 - $318,000
6
Beds
2
Baths
1,872
Sq Ft
$158/Sq Ft
Est. Value
About This Home
This home is located at 348 Brick Top Rd, Windham, CT 06280 and is currently estimated at $295,893, approximately $158 per square foot. 348 Brick Top Rd is a home located in Windham County with nearby schools including Windham Middle School, Windham High School, and St Mary St Joseph School.
Ownership History
Date
Name
Owned For
Owner Type
Purchase Details
Closed on
Oct 1, 2024
Sold by
Plesz Joseph M
Bought by
Stroncek Llc
Current Estimated Value
Purchase Details
Closed on
Jun 18, 1987
Sold by
Fichter Ex Angela
Bought by
Dailey Rubin
Home Financials for this Owner
Home Financials are based on the most recent Mortgage that was taken out on this home.
Original Mortgage
$67,000
Interest Rate
10.54%
Mortgage Type
Purchase Money Mortgage
Create a Home Valuation Report for This Property
The Home Valuation Report is an in-depth analysis detailing your home's value as well as a comparison with similar homes in the area
Home Values in the Area
Average Home Value in this Area
Purchase History
| Date | Buyer | Sale Price | Title Company |
|---|---|---|---|
| Stroncek Llc | -- | None Available | |
| Stroncek Llc | -- | None Available | |
| Dailey Rubin | $70,551 | -- |
Source: Public Records
Mortgage History
| Date | Status | Borrower | Loan Amount |
|---|---|---|---|
| Previous Owner | Dailey Rubin | $75,000 | |
| Previous Owner | Dailey Rubin | $51,100 | |
| Previous Owner | Dailey Rubin | $67,000 |
Source: Public Records
Tax History
| Year | Tax Paid | Tax Assessment Tax Assessment Total Assessment is a certain percentage of the fair market value that is determined by local assessors to be the total taxable value of land and additions on the property. | Land | Improvement |
|---|---|---|---|---|
| 2025 | $4,049 | $135,660 | $31,960 | $103,700 |
| 2024 | $4,055 | $135,660 | $31,960 | $103,700 |
| 2023 | $3,042 | $78,370 | $27,790 | $50,580 |
| 2022 | $2,963 | $78,370 | $27,790 | $50,580 |
| 2021 | $3,089 | $78,370 | $27,790 | $50,580 |
| 2020 | $3,049 | $78,370 | $27,790 | $50,580 |
| 2019 | $3,009 | $78,370 | $27,790 | $50,580 |
| 2017 | $2,476 | $64,260 | $29,450 | $34,810 |
| 2015 | $2,955 | $64,260 | $29,450 | $34,810 |
| 2014 | $2,202 | $64,260 | $29,450 | $34,810 |
Source: Public Records
Map
Nearby Homes