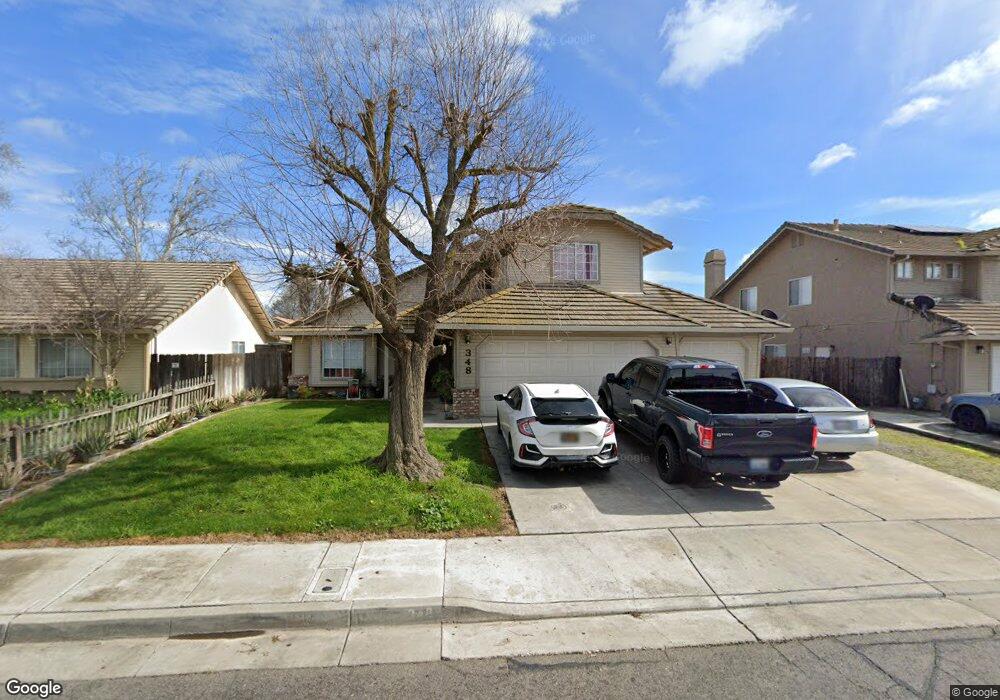
348 Chestnut St Los Banos, CA 93635
Estimated Value: $430,000 - $498,000
3
Beds
2
Baths
1,835
Sq Ft
$247/Sq Ft
Est. Value
About This Home
This home is located at 348 Chestnut St, Los Banos, CA 93635 and is currently estimated at $452,717, approximately $246 per square foot. 348 Chestnut St is a home located in Merced County with nearby schools including Los Banos Elementary School, Los Banos Junior High School, and Pacheco High School.
Ownership History
Date
Name
Owned For
Owner Type
Purchase Details
Closed on
Sep 29, 2010
Sold by
Federal Home Loan Mortgage Corporation
Bought by
Valdez Sepulveda Espinoza Manuel and Valdez De Sepulveda Ramona
Current Estimated Value
Home Financials for this Owner
Home Financials are based on the most recent Mortgage that was taken out on this home.
Original Mortgage
$128,272
Outstanding Balance
$84,344
Interest Rate
4.28%
Mortgage Type
FHA
Estimated Equity
$368,373
Purchase Details
Closed on
May 13, 2010
Sold by
Hicks Jimmy A and Hicks Charlene A
Bought by
Federal Home Loan Mortgage Corporation
Purchase Details
Closed on
May 27, 1997
Sold by
Giampietro Robert J and Giampietro Cynthia
Bought by
Hicks Jimmy A and Hicks Charlene A
Home Financials for this Owner
Home Financials are based on the most recent Mortgage that was taken out on this home.
Original Mortgage
$147,290
Interest Rate
7.58%
Mortgage Type
VA
Create a Home Valuation Report for This Property
The Home Valuation Report is an in-depth analysis detailing your home's value as well as a comparison with similar homes in the area
Home Values in the Area
Average Home Value in this Area
Purchase History
| Date | Buyer | Sale Price | Title Company |
|---|---|---|---|
| Valdez Sepulveda Espinoza Manuel | $130,000 | Security Union Title Ins Co | |
| Federal Home Loan Mortgage Corporation | $114,000 | Accommodation | |
| Hicks Jimmy A | $143,000 | Fidelity National Title Co |
Source: Public Records
Mortgage History
| Date | Status | Borrower | Loan Amount |
|---|---|---|---|
| Open | Valdez Sepulveda Espinoza Manuel | $128,272 | |
| Previous Owner | Hicks Jimmy A | $147,290 |
Source: Public Records
Tax History
| Year | Tax Paid | Tax Assessment Tax Assessment Total Assessment is a certain percentage of the fair market value that is determined by local assessors to be the total taxable value of land and additions on the property. | Land | Improvement |
|---|---|---|---|---|
| 2025 | $2,149 | $166,541 | $12,806 | $153,735 |
| 2024 | $2,149 | $163,276 | $12,555 | $150,721 |
| 2023 | $2,020 | $160,075 | $12,309 | $147,766 |
| 2022 | $1,969 | $156,937 | $12,068 | $144,869 |
| 2021 | $1,930 | $153,861 | $11,832 | $142,029 |
| 2020 | $1,900 | $152,284 | $11,711 | $140,573 |
| 2019 | $1,864 | $149,299 | $11,482 | $137,817 |
| 2018 | $1,808 | $146,372 | $11,257 | $135,115 |
| 2017 | $1,785 | $143,503 | $11,037 | $132,466 |
| 2016 | $1,785 | $140,690 | $10,821 | $129,869 |
| 2015 | $1,752 | $138,578 | $10,659 | $127,919 |
| 2014 | $1,709 | $135,865 | $10,451 | $125,414 |
Source: Public Records
Map
Nearby Homes
Your Personal Tour Guide
Ask me questions while you tour the home.