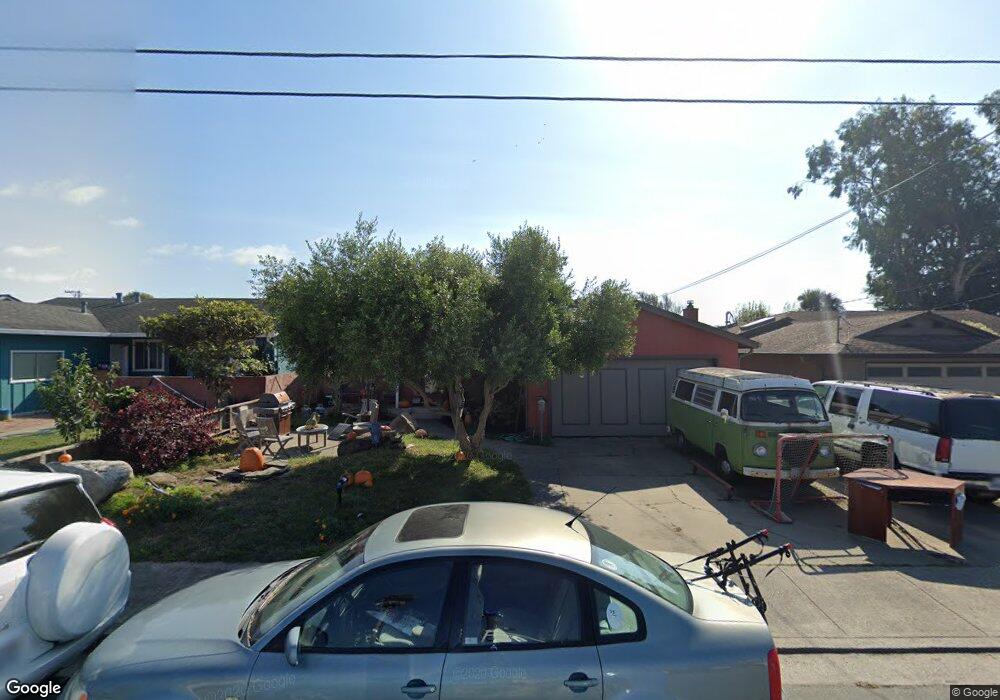
348 Filbert St Half Moon Bay, CA 94019
Estimated Value: $1,399,000 - $1,508,694
3
Beds
3
Baths
1,590
Sq Ft
$919/Sq Ft
Est. Value
About This Home
This home is located at 348 Filbert St, Half Moon Bay, CA 94019 and is currently estimated at $1,460,674, approximately $918 per square foot. 348 Filbert St is a home located in San Mateo County with nearby schools including Alvin S. Hatch Elementary School, Manuel F. Cunha Intermediate School, and Half Moon Bay High School.
Ownership History
Date
Name
Owned For
Owner Type
Purchase Details
Closed on
Jun 27, 2023
Sold by
Beebe Philip J and Beebe Amy M
Bought by
Beebe Family Trust and Beebe
Current Estimated Value
Purchase Details
Closed on
Apr 18, 2000
Sold by
Kay Bell and Clinton Scofield
Bought by
Beebe Philip J and Beebe Amy M
Home Financials for this Owner
Home Financials are based on the most recent Mortgage that was taken out on this home.
Original Mortgage
$405,000
Interest Rate
8.25%
Purchase Details
Closed on
Jul 10, 1995
Sold by
Bell Linda Sue Coburn
Bought by
Bell Kay and Scofield Clinton
Home Financials for this Owner
Home Financials are based on the most recent Mortgage that was taken out on this home.
Original Mortgage
$183,750
Interest Rate
7.74%
Create a Home Valuation Report for This Property
The Home Valuation Report is an in-depth analysis detailing your home's value as well as a comparison with similar homes in the area
Home Values in the Area
Average Home Value in this Area
Purchase History
| Date | Buyer | Sale Price | Title Company |
|---|---|---|---|
| Beebe Family Trust | -- | None Listed On Document | |
| Beebe Philip J | -- | None Listed On Document | |
| Beebe Philip J | $450,000 | Old Republic Title Company | |
| Bell Kay | $245,000 | Old Republic Title Company |
Source: Public Records
Mortgage History
| Date | Status | Borrower | Loan Amount |
|---|---|---|---|
| Previous Owner | Beebe Philip J | $405,000 | |
| Previous Owner | Bell Kay | $183,750 |
Source: Public Records
Tax History
| Year | Tax Paid | Tax Assessment Tax Assessment Total Assessment is a certain percentage of the fair market value that is determined by local assessors to be the total taxable value of land and additions on the property. | Land | Improvement |
|---|---|---|---|---|
| 2025 | $10,560 | $836,182 | $345,809 | $490,373 |
| 2023 | $10,560 | $803,715 | $332,382 | $471,333 |
| 2022 | $9,869 | $787,957 | $325,865 | $462,092 |
| 2021 | $9,587 | $772,508 | $319,476 | $453,032 |
| 2020 | $9,478 | $764,589 | $316,201 | $448,388 |
| 2019 | $9,385 | $749,598 | $310,001 | $439,597 |
| 2018 | $8,953 | $734,901 | $303,923 | $430,978 |
| 2017 | $8,799 | $720,492 | $297,964 | $422,528 |
| 2016 | $8,763 | $706,366 | $292,122 | $414,244 |
| 2015 | $8,608 | $695,758 | $287,735 | $408,023 |
| 2014 | $8,538 | $682,130 | $282,099 | $400,031 |
Source: Public Records
Map
Nearby Homes
- 345 Granelli Ave
- 614 Myrtle St
- 229 Garcia Ave
- 615 Grove St
- SW Cor 2nd Magnolia St
- 0 Magnolia Unit ML81987516
- 78 Amesport Landing
- 430 Pine Ave
- 460 Pine Ave Unit 46
- 466 Willow Ave
- 470 Willow Ave
- 525 Creekside Ct Unit LOT 2
- 535 Creekside Ct Unit LOT 3
- 577 Creekside Ct
- 414 Belleville Blvd
- 411 Belleville Blvd
- 71 Patrick Way
- 0 Van Ness Ave Unit ML82035609
- 606 Highland Ave
- 200 Dolores Ave
Your Personal Tour Guide
Ask me questions while you tour the home.