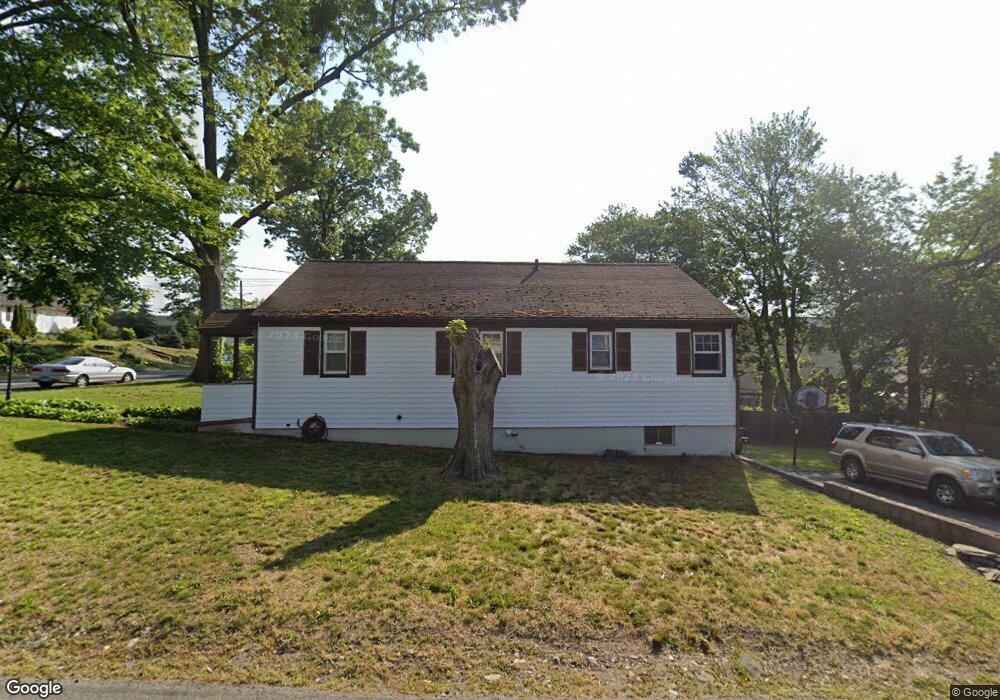
348 Harmony St Bridgeport, CT 06606
North End NeighborhoodEstimated Value: $259,000 - $402,000
3
Beds
1
Bath
1,120
Sq Ft
$322/Sq Ft
Est. Value
About This Home
This home is located at 348 Harmony St, Bridgeport, CT 06606 and is currently estimated at $361,015, approximately $322 per square foot. 348 Harmony St is a home located in Fairfield County with nearby schools including Blackham School, Central High School, and Northeastern Adventist Academy - Fairfield County.
Ownership History
Date
Name
Owned For
Owner Type
Purchase Details
Closed on
Nov 30, 1995
Sold by
Velez Carlos Est
Bought by
Sanon Thery
Current Estimated Value
Home Financials for this Owner
Home Financials are based on the most recent Mortgage that was taken out on this home.
Original Mortgage
$63,000
Interest Rate
7.37%
Mortgage Type
Unknown
Purchase Details
Closed on
Jun 14, 1995
Sold by
Ortiz Angel R and Ortiz Carmen E
Bought by
Velez Carlos
Create a Home Valuation Report for This Property
The Home Valuation Report is an in-depth analysis detailing your home's value as well as a comparison with similar homes in the area
Home Values in the Area
Average Home Value in this Area
Purchase History
| Date | Buyer | Sale Price | Title Company |
|---|---|---|---|
| Sanon Thery | $70,000 | -- | |
| Sanon Thery V | $70,000 | -- | |
| Velez Carlos | $84,000 | -- | |
| Velez Carlos | $84,000 | -- |
Source: Public Records
Mortgage History
| Date | Status | Borrower | Loan Amount |
|---|---|---|---|
| Closed | Velez Carlos | $90,100 | |
| Closed | Velez Carlos | $94,850 | |
| Closed | Velez Carlos | $63,000 |
Source: Public Records
Tax History
| Year | Tax Paid | Tax Assessment Tax Assessment Total Assessment is a certain percentage of the fair market value that is determined by local assessors to be the total taxable value of land and additions on the property. | Land | Improvement |
|---|---|---|---|---|
| 2025 | $6,163 | $141,830 | $73,120 | $68,710 |
| 2024 | $6,163 | $141,830 | $73,120 | $68,710 |
| 2023 | $6,163 | $141,830 | $73,120 | $68,710 |
| 2022 | $6,163 | $141,830 | $73,120 | $68,710 |
| 2021 | $6,163 | $141,830 | $73,120 | $68,710 |
| 2020 | $5,563 | $103,030 | $44,300 | $58,730 |
| 2019 | $5,563 | $103,030 | $44,300 | $58,730 |
| 2018 | $5,602 | $103,030 | $44,300 | $58,730 |
| 2017 | $5,602 | $103,030 | $44,300 | $58,730 |
| 2016 | $5,602 | $103,030 | $44,300 | $58,730 |
| 2015 | $5,535 | $131,170 | $44,670 | $86,500 |
| 2014 | $5,535 | $131,170 | $44,670 | $86,500 |
Source: Public Records
Map
Nearby Homes
- 138 Infield St
- 926 Hart St
- 916 Hart St
- 1265 Lindley St
- 45 Stevens St Unit 3L
- 329 Ezra St
- 355 Chamberlain Ave
- 457 Summit St
- 403 Indian Ave
- 355 Exeter St
- 213 Exeter St
- 219 Exeter St
- 245 Indian Ave
- 474 Indian Ave
- 936 Lindley St
- 208 Fairview Ave Unit 210
- 25 Westfield Ave
- 235 Douglas St
- 3461 Main St
- 45 Polk St
Your Personal Tour Guide
Ask me questions while you tour the home.