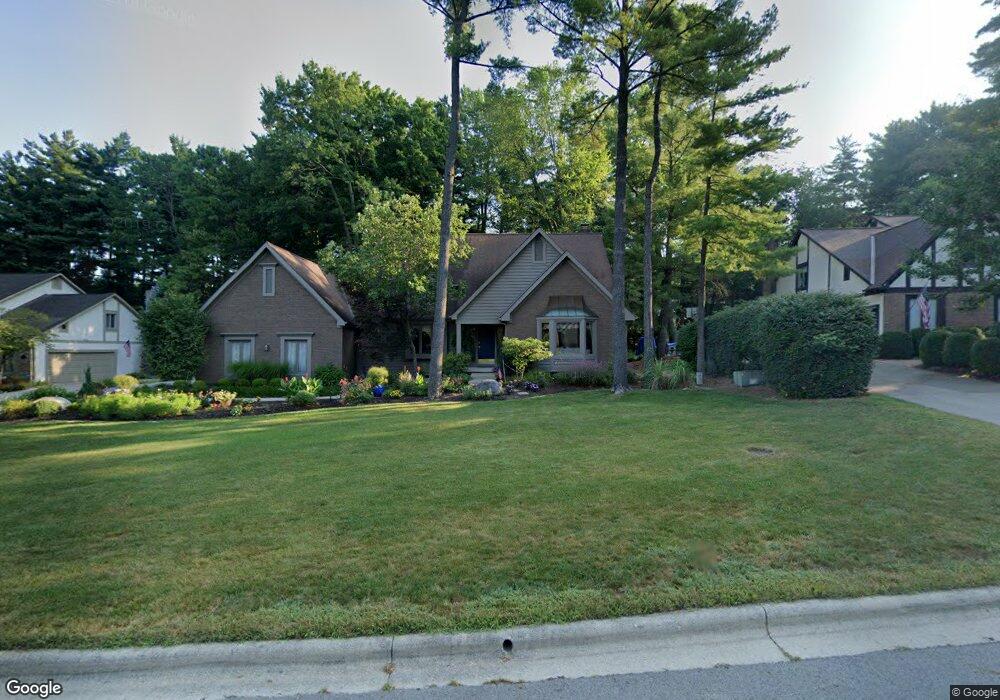
348 Jessing Trail Columbus, OH 43235
Woods at Josephinum NeighborhoodEstimated Value: $646,734 - $771,000
4
Beds
3
Baths
2,800
Sq Ft
$257/Sq Ft
Est. Value
About This Home
This home is located at 348 Jessing Trail, Columbus, OH 43235 and is currently estimated at $720,934, approximately $257 per square foot. 348 Jessing Trail is a home located in Franklin County with nearby schools including Worthington Hills Elementary School, McCord Middle School, and Worthington Kilbourne High School.
Ownership History
Date
Name
Owned For
Owner Type
Purchase Details
Closed on
Feb 18, 2018
Sold by
Karhoff Eric A and Karhoff Amanda P
Bought by
Karhoff Eric A and Karhoff Amanda P
Current Estimated Value
Purchase Details
Closed on
Apr 2, 1999
Sold by
Cadwallader John R and Cadwallader Elizabeth E
Bought by
Karhoff Eric A and Karhoff Amanda P
Home Financials for this Owner
Home Financials are based on the most recent Mortgage that was taken out on this home.
Original Mortgage
$238,800
Interest Rate
6.37%
Purchase Details
Closed on
Mar 14, 1995
Sold by
Tonti Barbara A
Bought by
Cadwallader John R and Cadwallader Elizabeth E
Home Financials for this Owner
Home Financials are based on the most recent Mortgage that was taken out on this home.
Original Mortgage
$230,000
Interest Rate
7.8%
Mortgage Type
New Conventional
Create a Home Valuation Report for This Property
The Home Valuation Report is an in-depth analysis detailing your home's value as well as a comparison with similar homes in the area
Home Values in the Area
Average Home Value in this Area
Purchase History
| Date | Buyer | Sale Price | Title Company |
|---|---|---|---|
| Karhoff Eric A | -- | None Available | |
| Karhoff Eric A | $298,500 | Chicago Title | |
| Cadwallader John R | $290,000 | -- |
Source: Public Records
Mortgage History
| Date | Status | Borrower | Loan Amount |
|---|---|---|---|
| Previous Owner | Karhoff Eric A | $238,800 | |
| Previous Owner | Cadwallader John R | $230,000 |
Source: Public Records
Tax History
| Year | Tax Paid | Tax Assessment Tax Assessment Total Assessment is a certain percentage of the fair market value that is determined by local assessors to be the total taxable value of land and additions on the property. | Land | Improvement |
|---|---|---|---|---|
| 2025 | $10,764 | $175,320 | $78,470 | $96,850 |
| 2024 | $10,764 | $175,320 | $78,470 | $96,850 |
| 2023 | $10,293 | $175,315 | $78,470 | $96,845 |
| 2022 | $9,450 | $127,720 | $38,360 | $89,360 |
| 2021 | $8,718 | $127,720 | $38,360 | $89,360 |
| 2020 | $8,398 | $127,720 | $38,360 | $89,360 |
| 2019 | $8,370 | $114,870 | $34,860 | $80,010 |
| 2018 | $7,921 | $114,870 | $34,860 | $80,010 |
| 2017 | $7,617 | $114,870 | $34,860 | $80,010 |
| 2016 | $7,733 | $108,920 | $33,180 | $75,740 |
| 2015 | $7,734 | $108,920 | $33,180 | $75,740 |
| 2014 | $7,732 | $108,920 | $33,180 | $75,740 |
| 2013 | $3,847 | $108,920 | $33,180 | $75,740 |
Source: Public Records
Map
Nearby Homes
- 203 Saint Pierre St
- 93 Forest Ridge Ct
- 809 Colony Ct
- 120 Saint Julien St Unit 36C
- 8144 Mount Air Place Unit 8144
- 1001 Rutherglen Dr
- 70 Highbluffs Blvd Unit 70
- 941 Clubview Blvd S
- 8322 Bruntsfield Rd Unit 8322
- 8326 Bruntsfield Rd
- 1041 Bluffway Dr
- 8422 Nuthatch Way
- 820 Old Woods Rd
- 0 Edgecliff Dr Unit 226005827
- 365 Cover Place
- 8380 Orchard Knoll Ln Unit 8380
- 167 Abbot Ave
- 579 Mawyer Dr Unit 168
- 717 Alta View Ct Unit 28
- 8483 Olenbrook Dr
- 360 Jessing Trail
- 336 Jessing Trail
- 337 Meditation Ln
- 325 Meditation Ln
- 374 Jessing Trail
- 320 Jessing Trail
- 339 Jessing Trail
- 349 Meditation Ln
- 353 Jessing Trail
- 325 Jessing Trail
- 313 Meditation Ln
- 369 Jessing Trail
- 363 Meditation Ln
- 388 Jessing Trail
- 314 Jessing Trail
- 381 Jessing Trail
- 301 Meditation Ln
- 379 Meditation Ln
- 342 Delegate Dr
- 354 Delegate Dr
Your Personal Tour Guide
Ask me questions while you tour the home.