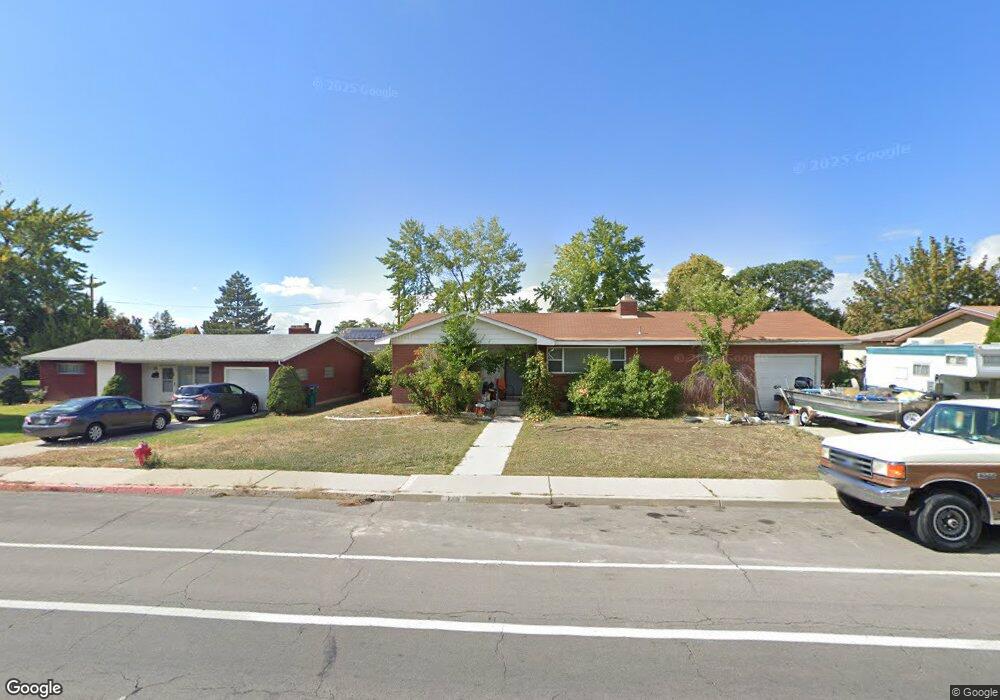
348 S 400 E Orem, UT 84097
SCERA NeighborhoodEstimated Value: $469,000 - $491,000
4
Beds
2
Baths
2,440
Sq Ft
$198/Sq Ft
Est. Value
About This Home
This home is located at 348 S 400 E, Orem, UT 84097 and is currently estimated at $482,776, approximately $197 per square foot. 348 S 400 E is a home located in Utah County with nearby schools including Centennial Elementary, Lakeridge Jr High School, and Orem High School.
Ownership History
Date
Name
Owned For
Owner Type
Purchase Details
Closed on
Jul 27, 2018
Sold by
Harward Bryan Scott and The N Ted Harward And D Lanond
Bought by
Newell Matthew L
Current Estimated Value
Home Financials for this Owner
Home Financials are based on the most recent Mortgage that was taken out on this home.
Original Mortgage
$255,290
Outstanding Balance
$217,921
Interest Rate
3.75%
Mortgage Type
FHA
Estimated Equity
$264,855
Purchase Details
Closed on
Aug 25, 1999
Sold by
Harward Newell Ted and Harward Della La Nondus
Bought by
Harward N Ted and Lanondus Harward D
Create a Home Valuation Report for This Property
The Home Valuation Report is an in-depth analysis detailing your home's value as well as a comparison with similar homes in the area
Home Values in the Area
Average Home Value in this Area
Purchase History
| Date | Buyer | Sale Price | Title Company |
|---|---|---|---|
| Newell Matthew L | -- | Us Title Insurance Agency | |
| Harward N Ted | -- | -- |
Source: Public Records
Mortgage History
| Date | Status | Borrower | Loan Amount |
|---|---|---|---|
| Open | Newell Matthew L | $255,290 |
Source: Public Records
Tax History
| Year | Tax Paid | Tax Assessment Tax Assessment Total Assessment is a certain percentage of the fair market value that is determined by local assessors to be the total taxable value of land and additions on the property. | Land | Improvement |
|---|---|---|---|---|
| 2025 | $1,765 | $229,350 | -- | -- |
| 2024 | $1,765 | $215,875 | $0 | $0 |
| 2023 | $1,622 | $213,180 | $0 | $0 |
| 2022 | $1,690 | $215,215 | $0 | $0 |
| 2021 | $1,563 | $301,500 | $139,400 | $162,100 |
| 2020 | $1,427 | $270,400 | $111,500 | $158,900 |
| 2019 | $1,334 | $263,000 | $104,100 | $158,900 |
| 2018 | $1,267 | $238,600 | $100,400 | $138,200 |
| 2017 | $1,204 | $121,495 | $0 | $0 |
| 2016 | $1,115 | $103,675 | $0 | $0 |
| 2015 | $1,137 | $100,045 | $0 | $0 |
| 2014 | $1,093 | $95,755 | $0 | $0 |
Source: Public Records
Map
Nearby Homes
Your Personal Tour Guide
Ask me questions while you tour the home.