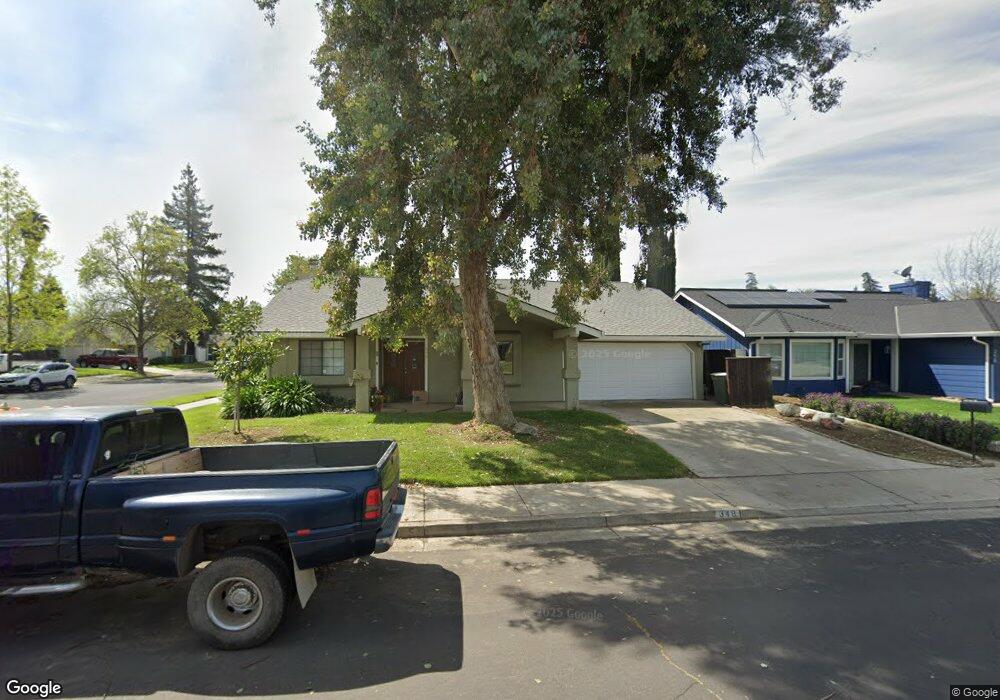
348 St Michelle Ct Merced, CA 95348
North Merced NeighborhoodEstimated Value: $347,000 - $406,000
3
Beds
2
Baths
1,514
Sq Ft
$248/Sq Ft
Est. Value
About This Home
This home is located at 348 St Michelle Ct, Merced, CA 95348 and is currently estimated at $376,134, approximately $248 per square foot. 348 St Michelle Ct is a home located in Merced County with nearby schools including Luther Burbank Elementary School, Herbert Hoover Middle School, and Merced High School.
Ownership History
Date
Name
Owned For
Owner Type
Purchase Details
Closed on
Aug 18, 2004
Sold by
Brenton Patrick Erica S and Brenton Patrick
Bought by
Patrick Erica S
Current Estimated Value
Home Financials for this Owner
Home Financials are based on the most recent Mortgage that was taken out on this home.
Original Mortgage
$50,000
Interest Rate
5.95%
Mortgage Type
Credit Line Revolving
Purchase Details
Closed on
Feb 18, 2000
Sold by
Lewis Madge E Trustee
Bought by
Dake Erica Spangler
Home Financials for this Owner
Home Financials are based on the most recent Mortgage that was taken out on this home.
Original Mortgage
$117,300
Interest Rate
8.26%
Mortgage Type
Purchase Money Mortgage
Purchase Details
Closed on
Dec 17, 1998
Sold by
Lewis Madge E
Bought by
Lewis Madge E
Home Financials for this Owner
Home Financials are based on the most recent Mortgage that was taken out on this home.
Original Mortgage
$106,422
Interest Rate
6.82%
Mortgage Type
FHA
Create a Home Valuation Report for This Property
The Home Valuation Report is an in-depth analysis detailing your home's value as well as a comparison with similar homes in the area
Home Values in the Area
Average Home Value in this Area
Purchase History
| Date | Buyer | Sale Price | Title Company |
|---|---|---|---|
| Patrick Erica S | -- | Chicago Title Company | |
| Dake Erica Spangler | $123,500 | Fidelity National Title Co | |
| Lewis Madge E | -- | Stewart Title |
Source: Public Records
Mortgage History
| Date | Status | Borrower | Loan Amount |
|---|---|---|---|
| Closed | Patrick Erica S | $50,000 | |
| Previous Owner | Dake Erica Spangler | $117,300 | |
| Previous Owner | Lewis Madge E | $106,422 |
Source: Public Records
Tax History
| Year | Tax Paid | Tax Assessment Tax Assessment Total Assessment is a certain percentage of the fair market value that is determined by local assessors to be the total taxable value of land and additions on the property. | Land | Improvement |
|---|---|---|---|---|
| 2025 | $1,939 | $189,794 | $46,096 | $143,698 |
| 2024 | $1,939 | $186,074 | $45,193 | $140,881 |
| 2023 | $1,911 | $182,426 | $44,307 | $138,119 |
| 2022 | $1,884 | $178,850 | $43,439 | $135,411 |
| 2021 | $1,878 | $175,344 | $42,588 | $132,756 |
| 2020 | $1,891 | $173,547 | $42,152 | $131,395 |
| 2019 | $1,862 | $170,145 | $41,326 | $128,819 |
| 2018 | $1,698 | $166,810 | $40,516 | $126,294 |
| 2017 | $1,760 | $163,540 | $39,722 | $123,818 |
| 2016 | $1,731 | $160,335 | $38,944 | $121,391 |
| 2015 | $1,703 | $157,928 | $38,360 | $119,568 |
| 2014 | $1,665 | $154,835 | $37,609 | $117,226 |
Source: Public Records
Map
Nearby Homes
- 315 Diane Ct
- 27 Emerald Dr
- 415 W 25th St
- 2933 Crestwood Ct
- 230 W 25th St
- 121 W 25th St
- 2500 N St Unit 270
- 2804 Mccombs Dr
- 2819 Tenaya Dr
- 8 W 25th St
- 2988 Briarwood Ct
- 3125 El Capitan Ave
- 0 E North Bear Creek Dr
- 1 E North Bear Creek Dr
- 439 E Olive Ave
- 319 W 22nd St
- 1061 Northwood Dr
- 425 E 27th St
- 112 W 23rd St
- 913 W Santa fe Ave
- 358 St Michelle Ct
- 2881 Saint Phillip Dr
- 2881 St Phillip Dr
- 368 St Michelle Ct
- 2871 St Phillip Dr
- 338 St Michelle Dr
- 349 St Michelle Ct
- 2880 St Phillip Dr
- 2882 St Thomas Ct
- 339 St Michelle Ct
- 2874 St Phillip Dr
- 359 St Michelle Ct
- 2872 St Thomas Ct
- 329 Michael Rd
- 329 St Michelle Dr
- 369 St Michelle Ct
- 2861 St Phillip Dr
- 2860 St Phillip Dr
- 388 St Michelle Ct
- 319 St Michelle Dr
Your Personal Tour Guide
Ask me questions while you tour the home.