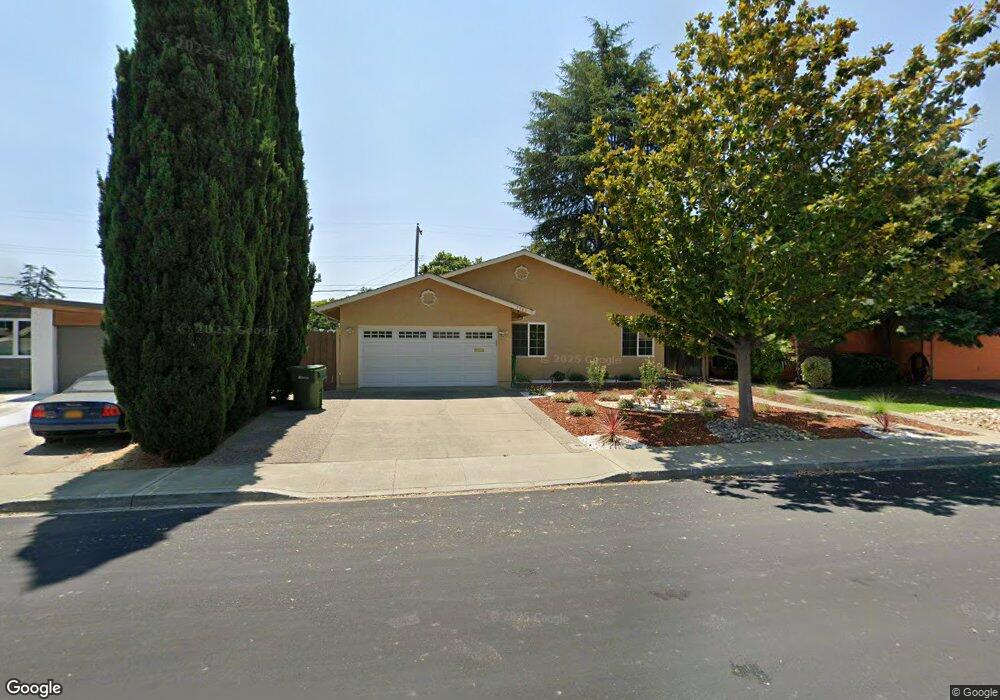
3480 Golden State Dr Santa Clara, CA 95051
Estimated Value: $1,756,000 - $2,433,000
3
Beds
2
Baths
1,705
Sq Ft
$1,197/Sq Ft
Est. Value
About This Home
This home is located at 3480 Golden State Dr, Santa Clara, CA 95051 and is currently estimated at $2,040,961, approximately $1,197 per square foot. 3480 Golden State Dr is a home located in Santa Clara County with nearby schools including Pomeroy Elementary School, Juan Cabrillo Middle School, and Santa Clara High School.
Ownership History
Date
Name
Owned For
Owner Type
Purchase Details
Closed on
Sep 12, 2014
Sold by
Rajagopalan Narayanan and Rajagopalan Uma
Bought by
Rajagopalan Family Living Trust and Rajagopalan Uma
Current Estimated Value
Purchase Details
Closed on
Oct 13, 1995
Sold by
Rajagopalan Divya
Bought by
Rajagopalan Narayanan and Rajagopalan Uma
Home Financials for this Owner
Home Financials are based on the most recent Mortgage that was taken out on this home.
Original Mortgage
$203,000
Interest Rate
7.63%
Purchase Details
Closed on
Aug 23, 1995
Sold by
Wood Donald R and Wood Kimberly T
Bought by
Rajagopalan Narayanan and Rajagopalan Uma
Home Financials for this Owner
Home Financials are based on the most recent Mortgage that was taken out on this home.
Original Mortgage
$203,000
Interest Rate
7.63%
Create a Home Valuation Report for This Property
The Home Valuation Report is an in-depth analysis detailing your home's value as well as a comparison with similar homes in the area
Home Values in the Area
Average Home Value in this Area
Purchase History
| Date | Buyer | Sale Price | Title Company |
|---|---|---|---|
| Rajagopalan Family Living Trust | -- | None Available | |
| Rajagopalan Narayanan | -- | -- | |
| Rajagopalan Narayanan | $215,000 | Stewart Title |
Source: Public Records
Mortgage History
| Date | Status | Borrower | Loan Amount |
|---|---|---|---|
| Previous Owner | Rajagopalan Narayanan | $203,000 |
Source: Public Records
Tax History Compared to Growth
Tax History
| Year | Tax Paid | Tax Assessment Tax Assessment Total Assessment is a certain percentage of the fair market value that is determined by local assessors to be the total taxable value of land and additions on the property. | Land | Improvement |
|---|---|---|---|---|
| 2025 | $6,814 | $592,911 | $207,645 | $385,266 |
| 2024 | $6,814 | $581,286 | $203,574 | $377,712 |
| 2023 | $6,744 | $569,889 | $199,583 | $370,306 |
| 2022 | $6,632 | $558,716 | $195,670 | $363,046 |
| 2021 | $6,603 | $547,762 | $191,834 | $355,928 |
| 2020 | $6,483 | $542,146 | $189,867 | $352,279 |
| 2019 | $6,473 | $531,517 | $186,145 | $345,372 |
| 2018 | $6,058 | $521,096 | $182,496 | $338,600 |
| 2017 | $6,027 | $510,879 | $178,918 | $331,961 |
| 2016 | $5,924 | $500,862 | $175,410 | $325,452 |
| 2015 | $5,900 | $493,340 | $172,776 | $320,564 |
| 2014 | -- | $245,965 | $169,392 | $76,573 |
Source: Public Records
Map
Nearby Homes
- 836 Pomeroy Ave Unit 70
- 840 Quince Ave Unit 27
- 834 Quince Ave Unit 37
- 3033 Kaiser Dr Unit H
- 1155 London Ave
- 1496 Mcpherson St
- 1545 Pomeroy Ave
- 960 Kiely Blvd Unit F
- 1014 Teal Dr
- 3513 Oxford Ct
- 1105 Lorne Way
- 940 Kiely Blvd Unit H
- 986 Kiely Blvd Unit D
- 1661 Nobili Ave
- 2971 Salem Dr
- Rey Plan at 3131 Camino
- Asis Plan at 3131 Camino
- Soledad Plan at 3131 Camino
- Arya Plan at 3131 Camino
- Sarria Plan at 3131 Camino
- 3476 Golden State Dr
- 3486 Golden State Dr
- 3470 Golden State Dr
- 3490 Golden State Dr
- 3485 Butcher Dr
- 3481 Butcher Dr
- 3491 Butcher Dr
- 3475 Butcher Dr
- 3496 Golden State Dr
- 3495 Butcher Dr
- 3483 Golden State Dr
- 3487 Golden State Dr
- 3477 Golden State Dr
- 968 Curtis Ave
- 954 Curtis Ave
- 3493 Golden State Dr
- 3473 Golden State Dr
- 3501 Butcher Dr
- 3500 Golden State Dr
- 3497 Golden State Dr