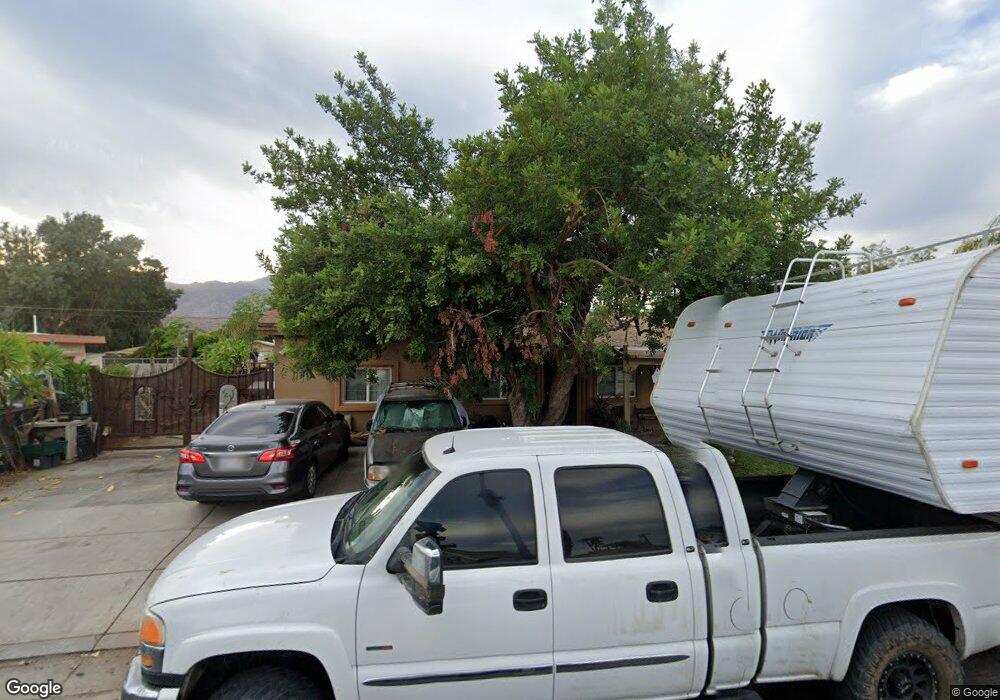
34809 Marcia Rd Cathedral City, CA 92234
Aqua Caliente South NeighborhoodEstimated Value: $127,000 - $588,000
4
Beds
5
Baths
1,944
Sq Ft
$192/Sq Ft
Est. Value
About This Home
This home is located at 34809 Marcia Rd, Cathedral City, CA 92234 and is currently estimated at $372,582, approximately $191 per square foot. 34809 Marcia Rd is a home located in Riverside County with nearby schools including Cathedral City Elementary School, Nellie N. Coffman Middle School, and Cathedral City High School.
Ownership History
Date
Name
Owned For
Owner Type
Purchase Details
Closed on
Nov 19, 2004
Sold by
Diaz J Manuel and Diaz Martha
Bought by
Duardo Elias and Duardo Maria Delosangeles
Current Estimated Value
Purchase Details
Closed on
Nov 6, 2000
Sold by
Kelley Michael Steven
Bought by
Diaz J Manuel and Diaz Martha
Purchase Details
Closed on
Feb 11, 1998
Sold by
Kelley Kelly Jean
Bought by
Kelley Michael Steven
Purchase Details
Closed on
Mar 3, 1995
Sold by
Nicholson Robert and Nicholson Gaye
Bought by
Psarras Anthony Jon
Purchase Details
Closed on
Mar 2, 1994
Sold by
Drummond Betty
Bought by
Psarras Tony
Home Financials for this Owner
Home Financials are based on the most recent Mortgage that was taken out on this home.
Original Mortgage
$67,000
Interest Rate
7.21%
Mortgage Type
Seller Take Back
Create a Home Valuation Report for This Property
The Home Valuation Report is an in-depth analysis detailing your home's value as well as a comparison with similar homes in the area
Home Values in the Area
Average Home Value in this Area
Purchase History
| Date | Buyer | Sale Price | Title Company |
|---|---|---|---|
| Duardo Elias | -- | -- | |
| Diaz J Manuel | -- | First American Title Co | |
| Kelley Michael Steven | -- | Orange Coast Title | |
| Kelley Michael Steven | -- | Orange Coast Title | |
| Psarras Anthony Jon | $15,000 | First American Title Ins Co | |
| Psarras Tony | $75,000 | Union Land Title Company |
Source: Public Records
Mortgage History
| Date | Status | Borrower | Loan Amount |
|---|---|---|---|
| Previous Owner | Psarras Tony | $67,000 |
Source: Public Records
Tax History Compared to Growth
Tax History
| Year | Tax Paid | Tax Assessment Tax Assessment Total Assessment is a certain percentage of the fair market value that is determined by local assessors to be the total taxable value of land and additions on the property. | Land | Improvement |
|---|---|---|---|---|
| 2025 | $2,993 | $128,466 | $27,107 | $101,359 |
| 2023 | $2,993 | $123,479 | $26,055 | $97,424 |
| 2022 | $2,748 | $121,059 | $25,545 | $95,514 |
| 2021 | $2,608 | $118,687 | $25,045 | $93,642 |
| 2020 | $2,485 | $117,471 | $24,789 | $92,682 |
| 2019 | $2,422 | $115,168 | $24,303 | $90,865 |
| 2018 | $2,347 | $112,911 | $23,828 | $89,083 |
| 2017 | $2,298 | $110,698 | $23,361 | $87,337 |
| 2016 | $2,240 | $108,528 | $22,903 | $85,625 |
| 2015 | $1,975 | $90,253 | $22,559 | $67,694 |
| 2014 | $1,956 | $88,487 | $22,118 | $66,369 |
Source: Public Records
Map
Nearby Homes
- 24 Mesa View Dr
- 34480 Vaquero Rd
- 80 Dunes Cir
- 88 Dunes Cir
- 392 Standing Bear
- 497 Prairie
- 230 Standing Bear Unit 230
- 248 Standing Bear
- 257 Wolf
- 189 Butterfield
- 438 Butterfield
- 326 Coyote
- 244 Standing Bear
- 69265 Nilda Dr
- 179 Butterfield
- 299 Butterfield
- 69295 Nilda Dr
- 69360 Vera Dr
- 174 Coyote
- 35070 Maria Rd
- 34811 Marcia Rd
- 34807 Marcia Rd
- 34762 Corregidor Dr
- 34750 Marcia Rd
- 34850 Corregidor Dr
- 34772 Corregidor Dr
- 34800 Marcia Rd
- 34700 Marcia Rd
- 34901 Marcia Rd Unit 4
- 34901 Marcia Rd Unit 1-4
- 34901 Marcia Rd
- 34711 Marcia Rd Unit A
- 34711 Marcia Rd
- 34720 Corregidor Dr
- 34894 Corregidor Dr
- 34900 Marcia Rd
- 34650 Marcia Rd
- 34855 Vaquero Rd
- 34655 Marcia Rd
- 34935 Marcia Rd