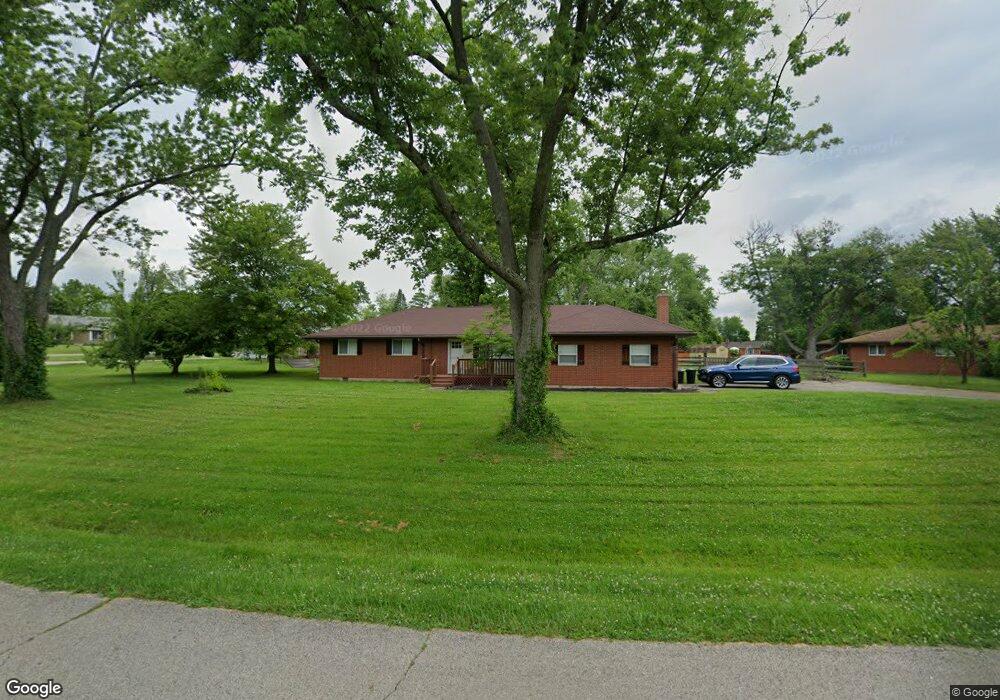
3483 S Dakar Dr Beavercreek, OH 45431
Estimated Value: $290,801 - $358,000
3
Beds
2
Baths
1,638
Sq Ft
$190/Sq Ft
Est. Value
About This Home
This home is located at 3483 S Dakar Dr, Beavercreek, OH 45431 and is currently estimated at $311,700, approximately $190 per square foot. 3483 S Dakar Dr is a home located in Greene County with nearby schools including Shaw Elementary School, Jacob Coy Middle School, and Beavercreek High School.
Ownership History
Date
Name
Owned For
Owner Type
Purchase Details
Closed on
Nov 28, 2017
Sold by
Smith Darren Nicholas and Smith Dena Renee
Bought by
Browning Roger S and Browning Judith A
Current Estimated Value
Home Financials for this Owner
Home Financials are based on the most recent Mortgage that was taken out on this home.
Original Mortgage
$124,687
Interest Rate
3.94%
Mortgage Type
New Conventional
Purchase Details
Closed on
May 15, 2015
Sold by
Peed Thomas J and Peed Bobbie Sue
Bought by
Smith Darren Nicholas and Smith Dena Renee
Home Financials for this Owner
Home Financials are based on the most recent Mortgage that was taken out on this home.
Original Mortgage
$143,010
Interest Rate
3.62%
Mortgage Type
VA
Purchase Details
Closed on
May 1, 2013
Sold by
Weimer Edward A and Doe Jane
Bought by
Peed Thomas J and Peed Bobbie Sue
Create a Home Valuation Report for This Property
The Home Valuation Report is an in-depth analysis detailing your home's value as well as a comparison with similar homes in the area
Home Values in the Area
Average Home Value in this Area
Purchase History
| Date | Buyer | Sale Price | Title Company |
|---|---|---|---|
| Browning Roger S | $166,300 | None Available | |
| Browning Roger S | $666,500 | -- | |
| Smith Darren Nicholas | $140,100 | Attorney | |
| Peed Thomas J | $96,000 | None Available |
Source: Public Records
Mortgage History
| Date | Status | Borrower | Loan Amount |
|---|---|---|---|
| Previous Owner | Browning Roger S | $124,687 | |
| Previous Owner | Smith Darren Nicholas | $143,010 |
Source: Public Records
Tax History Compared to Growth
Tax History
| Year | Tax Paid | Tax Assessment Tax Assessment Total Assessment is a certain percentage of the fair market value that is determined by local assessors to be the total taxable value of land and additions on the property. | Land | Improvement |
|---|---|---|---|---|
| 2024 | $5,771 | $86,680 | $19,990 | $66,690 |
| 2023 | $5,771 | $86,680 | $19,990 | $66,690 |
| 2022 | $4,925 | $65,290 | $16,660 | $48,630 |
| 2021 | $4,828 | $65,290 | $16,660 | $48,630 |
| 2020 | $4,864 | $65,290 | $16,660 | $48,630 |
| 2019 | $4,432 | $54,310 | $10,720 | $43,590 |
| 2018 | $3,923 | $54,310 | $10,720 | $43,590 |
| 2017 | $3,399 | $54,310 | $10,720 | $43,590 |
| 2016 | $3,399 | $46,650 | $10,720 | $35,930 |
| 2015 | $3,459 | $46,650 | $10,720 | $35,930 |
| 2014 | $3,409 | $46,650 | $10,720 | $35,930 |
Source: Public Records
Map
Nearby Homes
- 3331 Home Acres Ave
- 3653 Knollwood Dr
- 2212 Tulane Dr
- 1873 Turnbull Rd
- 3189 Claydor Dr
- 2402 Spicer Dr
- 3602 Queen Victoria Ct
- 2146 Oxmoor Dr
- 3194 Kingfisher Place
- 3611 King Edward Way
- 1946 N Longview St
- 2110 Grange Hall Rd
- 3951 La Bonne Rd
- 1778 N Longview St
- 2699 Golden Leaf Dr Unit 19-203
- 2745 Golden Leaf Dr Unit 18-303
- 1737 N Central Dr
- 2690 Gardenia Ave Unit 6
- 1641 Woods Dr
- 2982 Idaho Falls Dr
- 3465 S Dakar Dr
- 3481 N Dakar Dr
- 3490 S Dakar Dr
- 3473 N Dakar Dr
- 3480 S Dakar Dr
- 3455 S Dakar Dr
- 3476 S Dakar Dr
- 3466 S Dakar Dr
- 3453 N Dakar Dr
- 3510 S Dakar Dr
- 2160 Brookridge Dr
- 2170 Brookridge Dr
- 3456 S Dakar Dr
- 2150 Brookridge Dr
- 3488 N Dakar Dr
- 3443 S Dakar Dr
- 3478 N Dakar Dr
- 3445 N Dakar Dr
- 3468 N Dakar Dr
- 2180 Brookridge Dr