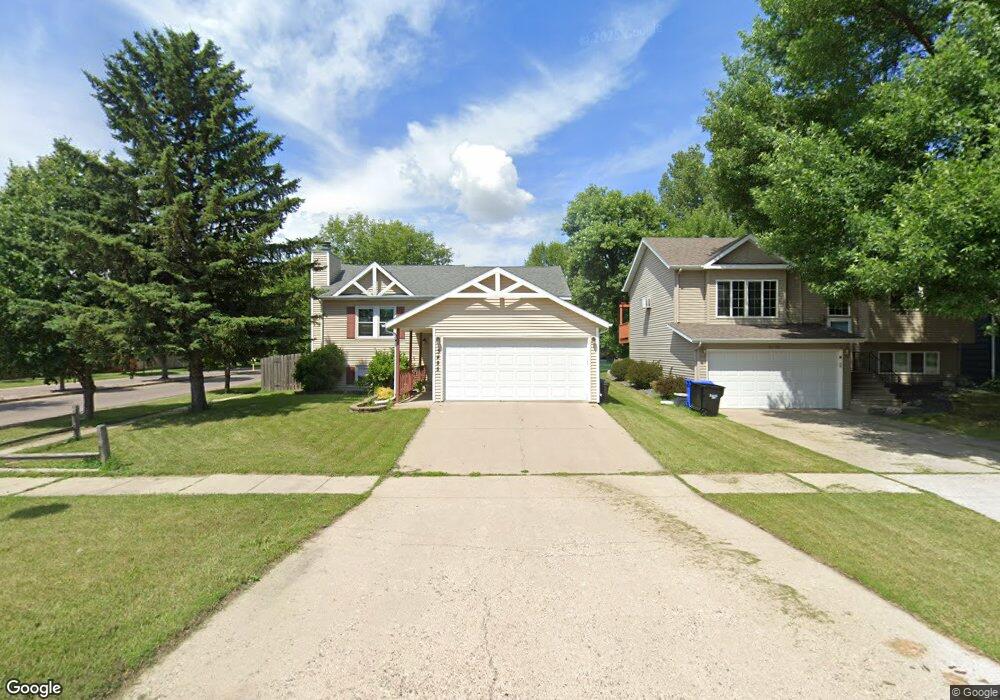
3485 18th St S Fargo, ND 58104
Southpointe NeighborhoodEstimated Value: $287,000 - $330,000
3
Beds
2
Baths
1,808
Sq Ft
$168/Sq Ft
Est. Value
About This Home
This home is located at 3485 18th St S, Fargo, ND 58104 and is currently estimated at $304,387, approximately $168 per square foot. 3485 18th St S is a home located in Cass County with nearby schools including Eagles Elementary School, Discovery Middle School, and Fargo Davies High School.
Ownership History
Date
Name
Owned For
Owner Type
Purchase Details
Closed on
Jun 2, 2023
Sold by
Wilson Alane M Weninger
Bought by
Wilson John D
Current Estimated Value
Purchase Details
Closed on
Jan 21, 2014
Sold by
Weninger Wilson John D and Weninger Wilson Alane M
Bought by
Weninger Wilson John D and Weninger Wilson Alane M
Home Financials for this Owner
Home Financials are based on the most recent Mortgage that was taken out on this home.
Original Mortgage
$131,000
Interest Rate
3.94%
Mortgage Type
New Conventional
Purchase Details
Closed on
Aug 29, 2005
Sold by
Braun Jeffrey S and Braun Danielle R
Bought by
Wilson John D
Home Financials for this Owner
Home Financials are based on the most recent Mortgage that was taken out on this home.
Original Mortgage
$111,920
Interest Rate
5.82%
Mortgage Type
New Conventional
Create a Home Valuation Report for This Property
The Home Valuation Report is an in-depth analysis detailing your home's value as well as a comparison with similar homes in the area
Home Values in the Area
Average Home Value in this Area
Purchase History
| Date | Buyer | Sale Price | Title Company |
|---|---|---|---|
| Wilson John D | -- | None Listed On Document | |
| Weninger Wilson John D | -- | Fm Title | |
| Wilson John D | -- | -- |
Source: Public Records
Mortgage History
| Date | Status | Borrower | Loan Amount |
|---|---|---|---|
| Previous Owner | Weninger Wilson John D | $131,000 | |
| Previous Owner | Wilson John D | $111,920 |
Source: Public Records
Tax History Compared to Growth
Tax History
| Year | Tax Paid | Tax Assessment Tax Assessment Total Assessment is a certain percentage of the fair market value that is determined by local assessors to be the total taxable value of land and additions on the property. | Land | Improvement |
|---|---|---|---|---|
| 2024 | $3,486 | $126,150 | $21,350 | $104,800 |
| 2023 | $3,468 | $126,150 | $21,350 | $104,800 |
| 2022 | $3,313 | $118,650 | $21,650 | $97,000 |
| 2021 | $2,967 | $107,850 | $21,650 | $86,200 |
| 2020 | $2,672 | $98,050 | $21,650 | $76,400 |
| 2019 | $2,674 | $98,050 | $12,850 | $85,200 |
| 2018 | $2,641 | $98,050 | $12,850 | $85,200 |
| 2017 | $2,605 | $98,050 | $12,850 | $85,200 |
| 2016 | $1,846 | $74,700 | $12,850 | $61,850 |
| 2015 | $1,792 | $67,900 | $8,800 | $59,100 |
| 2014 | $1,836 | $67,900 | $8,800 | $59,100 |
| 2013 | $1,680 | $64,900 | $8,800 | $56,100 |
Source: Public Records
Map
Nearby Homes