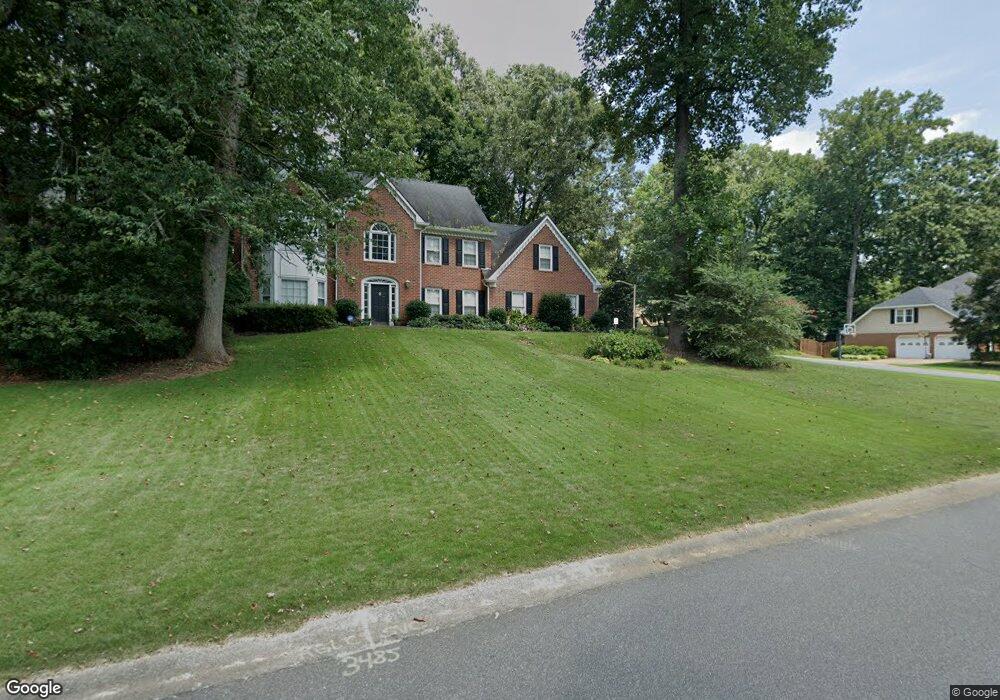
3485 Princeton Corners Dr Marietta, GA 30062
East Cobb NeighborhoodEstimated Value: $655,303 - $737,000
3
Beds
3
Baths
2,858
Sq Ft
$246/Sq Ft
Est. Value
About This Home
This home is located at 3485 Princeton Corners Dr, Marietta, GA 30062 and is currently estimated at $702,826, approximately $245 per square foot. 3485 Princeton Corners Dr is a home located in Cobb County with nearby schools including East Side Elementary School, Dodgen Middle School, and Walton High School.
Ownership History
Date
Name
Owned For
Owner Type
Purchase Details
Closed on
Mar 6, 2017
Sold by
Greenfield Karen S
Bought by
Hyman Robert R
Current Estimated Value
Home Financials for this Owner
Home Financials are based on the most recent Mortgage that was taken out on this home.
Original Mortgage
$221,500
Outstanding Balance
$190,796
Interest Rate
5.75%
Mortgage Type
New Conventional
Estimated Equity
$512,030
Purchase Details
Closed on
Sep 30, 2004
Sold by
Macias Armando and Macias Meredith
Bought by
Hyman Robert R and Hyman Karen
Home Financials for this Owner
Home Financials are based on the most recent Mortgage that was taken out on this home.
Original Mortgage
$258,900
Interest Rate
5.5%
Mortgage Type
New Conventional
Purchase Details
Closed on
Sep 24, 1997
Sold by
Smolen Joel A and Smolen Karen R
Bought by
Macias Armando and Macias Meredith C
Home Financials for this Owner
Home Financials are based on the most recent Mortgage that was taken out on this home.
Original Mortgage
$199,350
Interest Rate
7.6%
Mortgage Type
New Conventional
Create a Home Valuation Report for This Property
The Home Valuation Report is an in-depth analysis detailing your home's value as well as a comparison with similar homes in the area
Home Values in the Area
Average Home Value in this Area
Purchase History
| Date | Buyer | Sale Price | Title Company |
|---|---|---|---|
| Hyman Robert R | -- | -- | |
| Hyman Robert R | $333,900 | -- | |
| Macias Armando | $221,500 | -- |
Source: Public Records
Mortgage History
| Date | Status | Borrower | Loan Amount |
|---|---|---|---|
| Open | Hyman Robert R | $221,500 | |
| Previous Owner | Hyman Robert R | $258,900 | |
| Previous Owner | Macias Armando | $199,350 |
Source: Public Records
Tax History Compared to Growth
Tax History
| Year | Tax Paid | Tax Assessment Tax Assessment Total Assessment is a certain percentage of the fair market value that is determined by local assessors to be the total taxable value of land and additions on the property. | Land | Improvement |
|---|---|---|---|---|
| 2025 | $1,573 | $277,760 | $74,000 | $203,760 |
| 2024 | $1,535 | $263,404 | $60,000 | $203,404 |
| 2023 | $1,125 | $195,284 | $42,000 | $153,284 |
| 2022 | $4,833 | $195,284 | $42,000 | $153,284 |
| 2021 | $4,154 | $164,260 | $42,000 | $122,260 |
| 2020 | $4,154 | $164,260 | $42,000 | $122,260 |
| 2019 | $4,154 | $164,260 | $42,000 | $122,260 |
| 2018 | $4,154 | $164,260 | $42,000 | $122,260 |
| 2017 | $3,811 | $154,744 | $40,000 | $114,744 |
| 2016 | $3,818 | $154,744 | $40,000 | $114,744 |
| 2015 | $3,897 | $154,744 | $40,000 | $114,744 |
| 2014 | $3,191 | $122,100 | $0 | $0 |
Source: Public Records
Map
Nearby Homes
- 1200 Mitsy Forest Dr NE
- 0 Old Canton Rd NE Unit 10567243
- 0 Old Canton Rd NE Unit 7617214
- 3570 Brighton Place
- 2994 Octavia Cir
- 1120 Taliwa Trail NE
- 2880 Octavia Cir
- 1257 Independence Way
- 2868 Octavia Cir
- 2988 Nestle Creek Dr
- 2903 Ashebrooke Dr NE
- 1519 Brookcliff Cir
- 860 Mitsy Ridge Dr
- 1246 Stonecroft Way
- 1686 N Cobb Pkwy
- 718 Trevett Way
- 925 Sunny Meadows Ln
- 3495 Mill Bridge Dr Unit 2
- 2764 Brookcliff Landing
- 3520 Billingsley Dr
- 0 Princeton Corners Dr Unit 7044825
- 0 Princeton Corners Dr Unit 8440808
- 0 Princeton Corners Dr Unit 8123865
- 0 Princeton Corners Dr Unit 7626208
- 0 Princeton Corners Dr Unit 7617379
- 0 Princeton Corners Dr Unit 8778416
- 3485 Langdale Trail
- 3518 Billingsley Dr
- 3482 Princeton Corners Dr
- 3484 Princeton Corners Dr Unit II
- 3481 Princeton Corners Dr
- 3522 Billingsley Dr
- 3486 Princeton Corners Dr
- 3487 Princeton Corners Dr
- 1209 Maywood Ct
- 3516 Billingsley Dr Unit 2
- 3524 Billingsley Dr
- 0 Billingsley Dr Unit 8878534
- 0 Billingsley Dr Unit 8885429