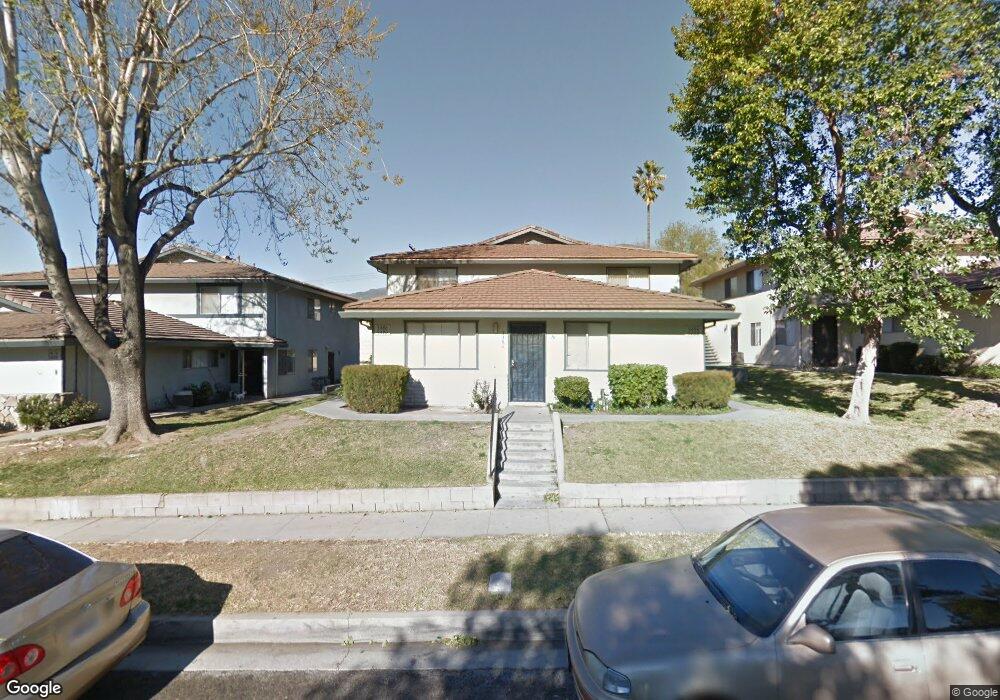
3486 20th St Highland, CA 92346
San Andreas NeighborhoodEstimated Value: $184,000 - $212,000
2
Beds
1
Bath
900
Sq Ft
$221/Sq Ft
Est. Value
About This Home
This home is located at 3486 20th St, Highland, CA 92346 and is currently estimated at $198,468, approximately $220 per square foot. 3486 20th St is a home located in San Bernardino County with nearby schools including Bonnie Oehl Elementary School, Serrano Middle School, and San Gorgonio High School.
Ownership History
Date
Name
Owned For
Owner Type
Purchase Details
Closed on
Feb 14, 2024
Sold by
Desi Enterprises Llc
Bought by
Sun Zeney J and Sun Huiting Chi
Current Estimated Value
Purchase Details
Closed on
Jun 17, 2010
Sold by
Bedi Reuben and Kaushal Anil
Bought by
Desi Enterprises Llc
Purchase Details
Closed on
Jul 29, 2009
Sold by
Bedi Chanda
Bought by
Bedi Reuban
Purchase Details
Closed on
Jul 17, 2009
Sold by
Us Bank National Association
Bought by
Bedi Reuban and Kaushal Anil
Purchase Details
Closed on
Jun 3, 2009
Sold by
Wooten Shaun
Bought by
Us Bank National Association
Purchase Details
Closed on
Dec 13, 2001
Sold by
Collins Maurice and Collins Deborah L
Bought by
Wooten Shaun
Create a Home Valuation Report for This Property
The Home Valuation Report is an in-depth analysis detailing your home's value as well as a comparison with similar homes in the area
Home Values in the Area
Average Home Value in this Area
Purchase History
| Date | Buyer | Sale Price | Title Company |
|---|---|---|---|
| Sun Zeney J | $175,000 | First American Title | |
| Desi Enterprises Llc | -- | None Available | |
| Desi Enterprises Llc | -- | None Available | |
| Bedi Reuban | -- | North American Title Company | |
| Bedi Reuban | $29,000 | North American Title Company | |
| Us Bank National Association | $30,000 | Accommodation | |
| Wooten Shaun | -- | Fidelity National Title Ins |
Source: Public Records
Tax History
| Year | Tax Paid | Tax Assessment Tax Assessment Total Assessment is a certain percentage of the fair market value that is determined by local assessors to be the total taxable value of land and additions on the property. | Land | Improvement |
|---|---|---|---|---|
| 2025 | $2,404 | $178,500 | $35,700 | $142,800 |
| 2024 | $636 | $36,573 | $6,328 | $30,245 |
| 2023 | $620 | $35,856 | $6,204 | $29,652 |
| 2022 | $616 | $35,153 | $6,082 | $29,071 |
| 2021 | $613 | $34,464 | $5,963 | $28,501 |
| 2020 | $610 | $34,111 | $5,902 | $28,209 |
| 2019 | $596 | $33,442 | $5,786 | $27,656 |
| 2018 | $591 | $32,787 | $5,673 | $27,114 |
| 2017 | $573 | $32,144 | $5,562 | $26,582 |
| 2016 | $557 | $31,514 | $5,453 | $26,061 |
| 2015 | $416 | $31,041 | $5,371 | $25,670 |
| 2014 | $404 | $30,433 | $5,266 | $25,167 |
Source: Public Records
Map
Nearby Homes
- 3465 20th St
- 3535 20th St
- 2111 Orange St
- 3504 Rainbow Ln
- 3436 Rainbow Ln
- 3568 20th St
- 2035 Reedy Ave
- 2004 Palm Ave
- 3383 Highland Ave
- 2226 Cole Ct
- 1911 Reedy Ave
- 2221 Baldridge Canyon Ct
- 2243 Cole Ct
- 3505 Orchid Dr E
- 2137 Pepper Dr
- 3537 E Orchid Dr
- 3553 E Highland Ave
- 1991 Central Ave Unit 2
- 27126 Pacific St
- 2535 Mercedes Ave
Your Personal Tour Guide
Ask me questions while you tour the home.