3487 Fenton Dr SE Unit 3487 Smyrna, GA 30080
Estimated Value: $583,438 - $647,000
3
Beds
4
Baths
2,074
Sq Ft
$299/Sq Ft
Est. Value
About This Home
This home is located at 3487 Fenton Dr SE Unit 3487, Smyrna, GA 30080 and is currently estimated at $619,610, approximately $298 per square foot. 3487 Fenton Dr SE Unit 3487 is a home located in Cobb County with nearby schools including Teasley Elementary School, Campbell Middle School, and Campbell High School.
Ownership History
Date
Name
Owned For
Owner Type
Purchase Details
Closed on
Nov 30, 2021
Sold by
Thomas Reese
Bought by
Adesagba Phillip Shogga
Current Estimated Value
Home Financials for this Owner
Home Financials are based on the most recent Mortgage that was taken out on this home.
Original Mortgage
$420,000
Outstanding Balance
$326,306
Interest Rate
2.35%
Mortgage Type
New Conventional
Estimated Equity
$293,304
Purchase Details
Closed on
Oct 18, 2019
Sold by
Trest Elizabeth
Bought by
Reese Thoams and Reese Deborah
Home Financials for this Owner
Home Financials are based on the most recent Mortgage that was taken out on this home.
Original Mortgage
$305,000
Interest Rate
3.7%
Mortgage Type
New Conventional
Purchase Details
Closed on
Dec 23, 2016
Sold by
Crp Eah Ar Llc
Bought by
Trest Elizabeth
Purchase Details
Closed on
Dec 21, 2016
Sold by
Elizabeth
Bought by
The Elizabeth Wilde Trest Rev
Create a Home Valuation Report for This Property
The Home Valuation Report is an in-depth analysis detailing your home's value as well as a comparison with similar homes in the area
Home Values in the Area
Average Home Value in this Area
Purchase History
| Date | Buyer | Sale Price | Title Company |
|---|---|---|---|
| Adesagba Phillip Shogga | $525,000 | Mcmanamy Mcleod Heller Llc | |
| Reese Thoams | -- | -- | |
| Reese Thomas | $480,000 | -- | |
| Trest Elizabeth | $478,544 | -- | |
| The Elizabeth Wilde Trest Rev | -- | -- |
Source: Public Records
Mortgage History
| Date | Status | Borrower | Loan Amount |
|---|---|---|---|
| Open | Adesagba Phillip Shogga | $420,000 | |
| Previous Owner | Reese Thomas | $305,000 |
Source: Public Records
Tax History Compared to Growth
Tax History
| Year | Tax Paid | Tax Assessment Tax Assessment Total Assessment is a certain percentage of the fair market value that is determined by local assessors to be the total taxable value of land and additions on the property. | Land | Improvement |
|---|---|---|---|---|
| 2025 | $6,536 | $240,680 | $70,000 | $170,680 |
| 2024 | $6,541 | $240,680 | $70,000 | $170,680 |
| 2023 | $5,603 | $222,472 | $60,000 | $162,472 |
| 2022 | $5,766 | $203,156 | $60,000 | $143,156 |
| 2021 | $5,438 | $188,200 | $60,000 | $128,200 |
| 2020 | $5,438 | $188,200 | $60,000 | $128,200 |
| 2019 | $2,016 | $188,200 | $60,000 | $128,200 |
| 2018 | $1,997 | $181,796 | $60,000 | $121,796 |
| 2017 | $1,723 | $181,796 | $60,000 | $121,796 |
| 2016 | $633 | $22,000 | $22,000 | $0 |
Source: Public Records
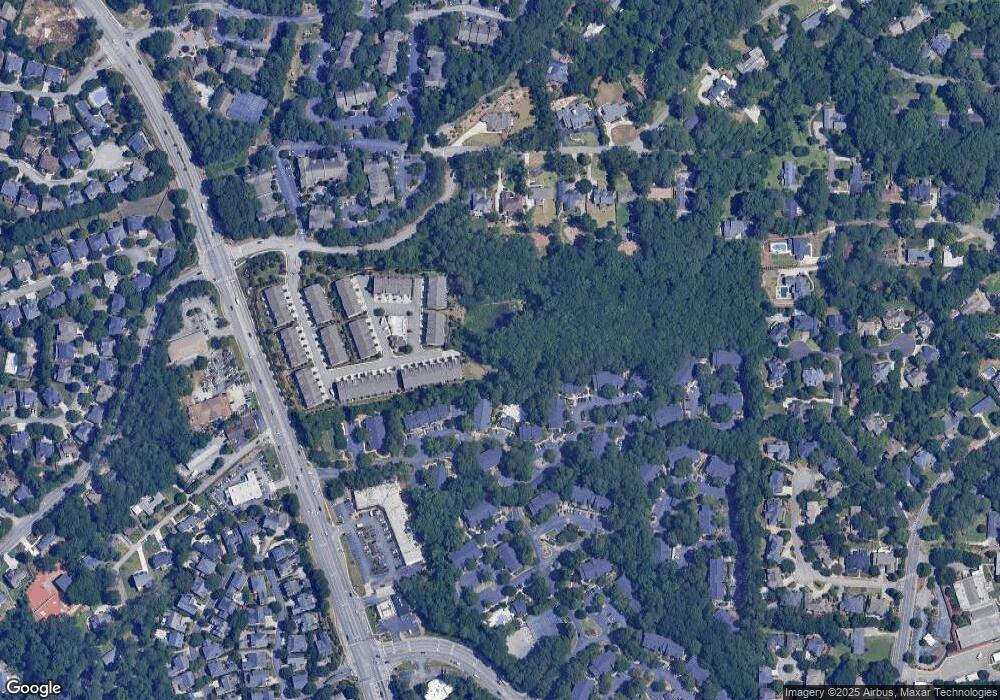
Map
Nearby Homes
- 3465 Fenton Dr SE
- 2128 Sonoma Dr SE
- 3522 Ivy Manor Rd SE
- 2002 Ivy Ridge Rd SE
- Glover Plan at Archerfield
- Reynolds Plan at Archerfield
- 2040 Argyle Dr SE
- 3505 Commanche Ct SE
- 3365 Vintage Cir SE Unit 5
- 3365 Vintage Cir SE
- 3412 Archerfield Way
- 3721 Paces Park Cir SE
- 3351 Vintage Cir SE
- 3415 Archerfield Way
- 3404 Archerfield Way
- 3320 Sleepy Ln SE
- 3408 Archerfield Way
- 3416 Archerfield Way
- 3534 Clancy Way Unit 11
- 1982 Cheyanne Dr SE
- 3487 Fenton Dr SE Unit 59
- 3487 Fenton Dr SE
- 3491 Fenton Dr
- 3491 Fenton Dr Unit 58
- 3477 Fenton Dr SE
- 3477 Fenton Dr SE
- 3477 Fenton Dr SE Unit 60
- 3473 Fenton Dr SE
- 3473 Fenton Dr SE Unit 61
- 3495 Fenton Dr Unit 57
- 3495 Fenton Dr
- 3499 Fenton Dr SE
- 3499 Fenton Dr Unit 56
- 3499 Fenton Dr
- 3525 Atlanta Rd SE
- 3469 Fenton Dr SE
- 3469 Fenton Dr SE Unit 62
- 3503 Fenton Dr SE
- 3618 Locklyn Ln SE
- 3622 Locklyn Ln SE