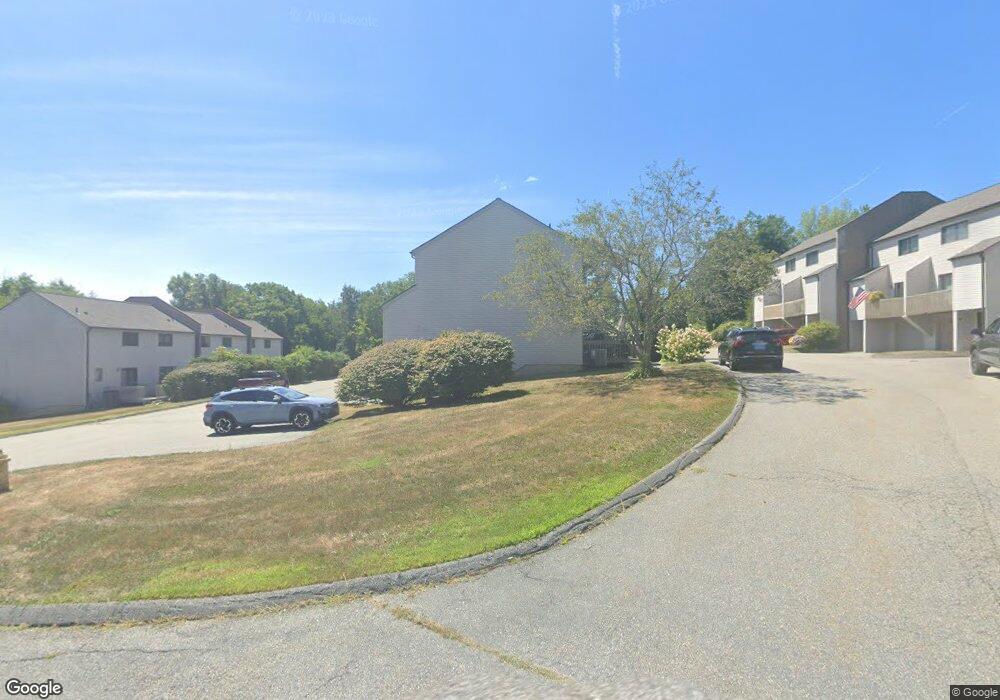
349 Allen Rd Unit 12A Torrington, CT 06790
Estimated Value: $184,000 - $286,000
2
Beds
1
Bath
988
Sq Ft
$215/Sq Ft
Est. Value
About This Home
This home is located at 349 Allen Rd Unit 12A, Torrington, CT 06790 and is currently estimated at $212,643, approximately $215 per square foot. 349 Allen Rd Unit 12A is a home located in Litchfield County with nearby schools including Torrington Middle School, Torrington High School, and St. Peter School.
Ownership History
Date
Name
Owned For
Owner Type
Purchase Details
Closed on
Mar 24, 2009
Sold by
Thompson Douglas M
Bought by
Mcmurdy Erica A
Current Estimated Value
Home Financials for this Owner
Home Financials are based on the most recent Mortgage that was taken out on this home.
Original Mortgage
$100,100
Outstanding Balance
$64,054
Interest Rate
5.25%
Estimated Equity
$148,589
Purchase Details
Closed on
Jun 17, 2004
Sold by
Laroche Joseph A
Bought by
Thompson Douglas M
Home Financials for this Owner
Home Financials are based on the most recent Mortgage that was taken out on this home.
Original Mortgage
$95,232
Interest Rate
6.12%
Purchase Details
Closed on
Sep 22, 2003
Sold by
Axler Edward C
Bought by
Laroche Joseph A
Create a Home Valuation Report for This Property
The Home Valuation Report is an in-depth analysis detailing your home's value as well as a comparison with similar homes in the area
Home Values in the Area
Average Home Value in this Area
Purchase History
| Date | Buyer | Sale Price | Title Company |
|---|---|---|---|
| Mcmurdy Erica A | $102,000 | -- | |
| Mcmurdy Erica A | $102,000 | -- | |
| Thompson Douglas M | $93,000 | -- | |
| Thompson Douglas M | $93,000 | -- | |
| Laroche Joseph A | $83,000 | -- | |
| Laroche Joseph A | $83,000 | -- |
Source: Public Records
Mortgage History
| Date | Status | Borrower | Loan Amount |
|---|---|---|---|
| Open | Laroche Joseph A | $100,100 | |
| Closed | Laroche Joseph A | $100,100 | |
| Previous Owner | Laroche Joseph A | $95,232 |
Source: Public Records
Tax History Compared to Growth
Tax History
| Year | Tax Paid | Tax Assessment Tax Assessment Total Assessment is a certain percentage of the fair market value that is determined by local assessors to be the total taxable value of land and additions on the property. | Land | Improvement |
|---|---|---|---|---|
| 2025 | $4,371 | $113,680 | $0 | $113,680 |
| 2024 | $2,201 | $45,890 | $0 | $45,890 |
| 2023 | $2,201 | $45,890 | $0 | $45,890 |
| 2022 | $2,163 | $45,890 | $0 | $45,890 |
| 2021 | $2,119 | $45,890 | $0 | $45,890 |
| 2020 | $2,119 | $45,890 | $0 | $45,890 |
| 2019 | $1,918 | $41,540 | $0 | $41,540 |
| 2018 | $1,918 | $41,540 | $0 | $41,540 |
| 2017 | $1,900 | $41,540 | $0 | $41,540 |
| 2016 | $1,900 | $41,540 | $0 | $41,540 |
| 2015 | $1,900 | $41,540 | $0 | $41,540 |
| 2014 | $2,459 | $67,710 | $0 | $67,710 |
Source: Public Records
Map
Nearby Homes
- 68 Westledge Terrace
- 7 Ford Ln
- 80 Baron Ln
- 39 Baron Ln
- 0 Highland Ave Unit 24088105
- 271 Heights Dr
- 213 Spring St
- 58 Eggleston St
- 95 Colorado Ave N
- 70 Greenfield Dr
- 103 Greenfield Dr
- 244 Hawthorne Terrace
- 77 Chestnut Ave
- 91 Riverside Ave
- 27 Washington Ave
- 121 Culvert St
- 231 Beechwood Ave
- 23 Berry St
- 136 Wyoming Ave
- 30 Culvert St
- 349 Allen Rd Unit 15A
- 349 Allen Rd Unit 21B
- 349 Allen Rd Unit 43D
- 349 Allen Rd Unit 23B
- 349 Allen Rd Unit 16A
- 349 Allen Rd Unit 35C
- 349 Allen Rd Unit 45D
- 349 Allen Rd Unit 40D
- 349 Allen Rd Unit 14A
- 349 Allen Rd Unit 10A
- 349 Allen Rd Unit 31C
- 349 Allen Rd Unit 44D
- 349 Allen Rd Unit 41D
- 349 Allen Rd Unit 11A
- 349 Allen Rd Unit 30C
- 349 Allen Rd Unit 25B
- 349 Allen Rd Unit 32C
- 349 Allen Rd Unit 42D
- 349 Allen Rd Unit 34C
- 349 Allen Rd Unit 33C