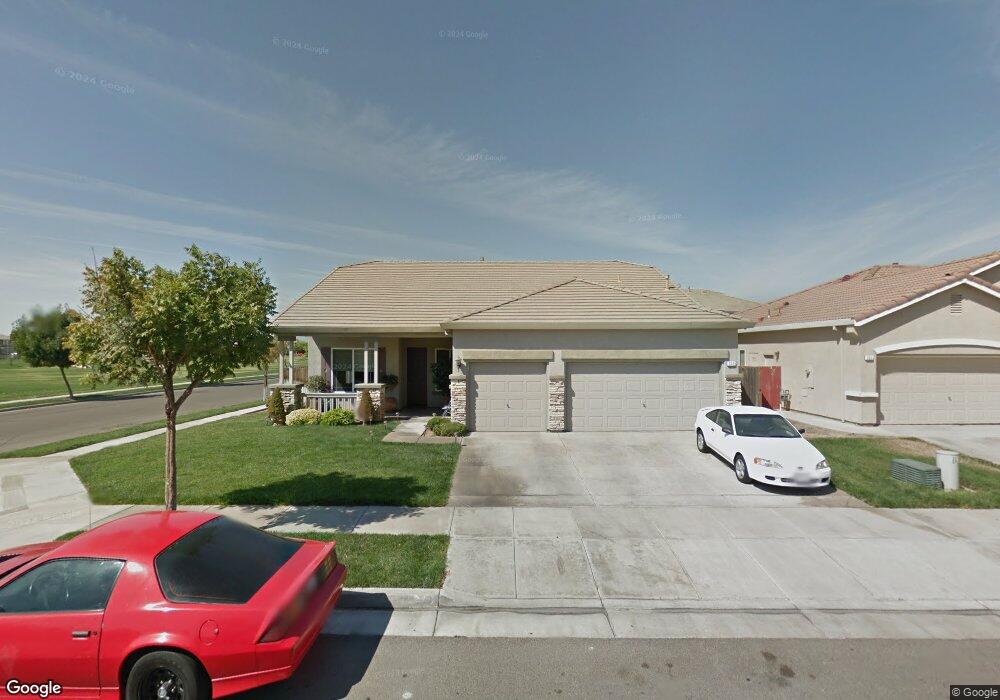
349 Castellana St Los Banos, CA 93635
Estimated Value: $503,655 - $555,000
3
Beds
2
Baths
2,188
Sq Ft
$244/Sq Ft
Est. Value
About This Home
This home is located at 349 Castellana St, Los Banos, CA 93635 and is currently estimated at $532,914, approximately $243 per square foot. 349 Castellana St is a home located in Merced County with nearby schools including Grasslands Elementary School, Los Banos Junior High School, and Pacheco High School.
Ownership History
Date
Name
Owned For
Owner Type
Purchase Details
Closed on
Oct 8, 2008
Sold by
Lasalle Bank Na
Bought by
Zaas Kenneth A and Zaas Shauna J
Current Estimated Value
Home Financials for this Owner
Home Financials are based on the most recent Mortgage that was taken out on this home.
Original Mortgage
$179,629
Outstanding Balance
$115,599
Interest Rate
5.77%
Mortgage Type
FHA
Estimated Equity
$417,315
Purchase Details
Closed on
Apr 22, 2008
Sold by
Sanchez Zeferino and Sanchez Guadalupe
Bought by
Lasalle Bank Na
Purchase Details
Closed on
Mar 25, 2004
Sold by
Woodside Verona Inc
Bought by
Sanchez Zeferino and Sanchez Guadalupe
Home Financials for this Owner
Home Financials are based on the most recent Mortgage that was taken out on this home.
Original Mortgage
$304,750
Interest Rate
4.87%
Mortgage Type
Purchase Money Mortgage
Create a Home Valuation Report for This Property
The Home Valuation Report is an in-depth analysis detailing your home's value as well as a comparison with similar homes in the area
Home Values in the Area
Average Home Value in this Area
Purchase History
| Date | Buyer | Sale Price | Title Company |
|---|---|---|---|
| Zaas Kenneth A | $182,000 | Chicago Title Company | |
| Lasalle Bank Na | $235,540 | None Available | |
| Sanchez Zeferino | $321,000 | Old Republic Title Company |
Source: Public Records
Mortgage History
| Date | Status | Borrower | Loan Amount |
|---|---|---|---|
| Open | Zaas Kenneth A | $179,629 | |
| Previous Owner | Sanchez Zeferino | $304,750 |
Source: Public Records
Tax History Compared to Growth
Tax History
| Year | Tax Paid | Tax Assessment Tax Assessment Total Assessment is a certain percentage of the fair market value that is determined by local assessors to be the total taxable value of land and additions on the property. | Land | Improvement |
|---|---|---|---|---|
| 2025 | $2,820 | $234,359 | $83,697 | $150,662 |
| 2024 | $2,820 | $229,764 | $82,056 | $147,708 |
| 2023 | $2,665 | $225,260 | $80,448 | $144,812 |
| 2022 | $2,615 | $220,844 | $78,871 | $141,973 |
| 2021 | $2,578 | $216,515 | $77,325 | $139,190 |
| 2020 | $2,540 | $214,296 | $76,533 | $137,763 |
| 2019 | $2,490 | $210,095 | $75,033 | $135,062 |
| 2018 | $2,415 | $205,976 | $73,562 | $132,414 |
| 2017 | $2,376 | $201,938 | $72,120 | $129,818 |
| 2016 | $2,389 | $197,979 | $70,706 | $127,273 |
| 2015 | $2,333 | $195,006 | $69,644 | $125,362 |
| 2014 | $2,273 | $191,187 | $68,280 | $122,907 |
Source: Public Records
Map
Nearby Homes
- 2272 Sanders Ct
- 2271 Corsico Ct
- 256 Murano St
- 2095 Palermo Dr
- 511 Milano Ct
- 2080 Constantine Ct
- Residence 1 Plan at Southpointe - Sierra Heights
- Residence 2 Plan at Southpointe - Sierra Heights
- Residence 3 Plan at Southpointe - Sierra Heights
- 412 Barrett Ln
- 425 Kelley Ct
- 416 Barrett Ln
- 2066 Greenbriar Dr
- 424 Barrett Ln
- 420 Barrett Ln
- The Stella Plan at Southpointe
- The Argent Plan at Southpointe
- The Fasano Plan at Southpointe
- The Monterey Plan at Southpointe
- The Caledonia Plan at Southpointe
- 355 Castellana St
- 348 Treviso Ct
- 354 Treviso Ct
- 361 Castellana St
- 2247 Cantania Ct
- 358 Treviso Ct
- 2246 Assisi Ct
- 2255 Cantania Ct
- 2248 Cantania Ct
- 2254 Assisi Ct
- 360 Treviso Ct
- 371 Castellana St Unit 319
- 347 Treviso Ct
- 2256 Cantania Ct
- 2263 Cantania Ct
- 353 Treviso Ct
- 2262 Assisi Ct
- 357 Treviso Ct
- 2253 Owens Ct
- 2177 Coulter Ln Unit 345P