349 Harmony St Bridgeport, CT 06606
North End NeighborhoodEstimated Value: $410,000 - $414,000
3
Beds
2
Baths
1,365
Sq Ft
$302/Sq Ft
Est. Value
About This Home
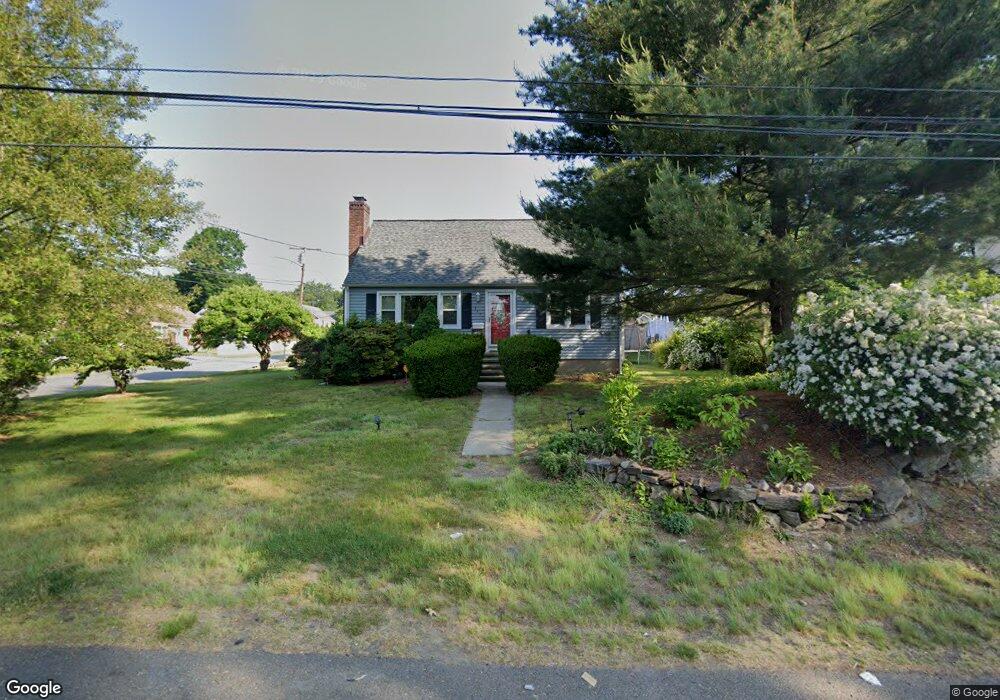
This home is located at 349 Harmony St, Bridgeport, CT 06606 and is currently estimated at $412,111, approximately $301 per square foot. 349 Harmony St is a home located in Fairfield County with nearby schools including Blackham School, Central High School, and Northeastern Adventist Academy - Fairfield County.
Ownership History
Date
Name
Owned For
Owner Type
Purchase Details
Closed on
May 21, 1998
Sold by
Graham Efrosina T
Bought by
Richardson Valerie
Current Estimated Value
Create a Home Valuation Report for This Property
The Home Valuation Report is an in-depth analysis detailing your home's value as well as a comparison with similar homes in the area
Home Values in the Area
Average Home Value in this Area
Purchase History
| Date | Buyer | Sale Price | Title Company |
|---|---|---|---|
| Richardson Valerie | $87,000 | -- | |
| Richardson Valerie | $87,000 | -- |
Source: Public Records
Mortgage History
| Date | Status | Borrower | Loan Amount |
|---|---|---|---|
| Open | Richardson Valerie | $172,975 | |
| Closed | Richardson Valerie | $161,000 | |
| Closed | Richardson Valerie | $108,938 | |
| Closed | Richardson Valerie | $16,092 |
Source: Public Records
Tax History
| Year | Tax Paid | Tax Assessment Tax Assessment Total Assessment is a certain percentage of the fair market value that is determined by local assessors to be the total taxable value of land and additions on the property. | Land | Improvement |
|---|---|---|---|---|
| 2025 | $7,303 | $168,070 | $63,810 | $104,260 |
| 2024 | $7,303 | $168,070 | $63,810 | $104,260 |
| 2023 | $7,303 | $168,070 | $63,810 | $104,260 |
| 2022 | $7,303 | $168,070 | $63,810 | $104,260 |
| 2021 | $7,303 | $168,070 | $63,810 | $104,260 |
| 2020 | $5,962 | $110,420 | $38,680 | $71,740 |
| 2019 | $5,962 | $110,420 | $38,680 | $71,740 |
| 2018 | $6,004 | $110,420 | $38,680 | $71,740 |
| 2017 | $6,004 | $110,420 | $38,680 | $71,740 |
| 2016 | $6,004 | $110,420 | $38,680 | $71,740 |
| 2015 | $5,234 | $124,030 | $39,000 | $85,030 |
| 2014 | $5,234 | $124,030 | $39,000 | $85,030 |
Source: Public Records
Map
Nearby Homes
- 138 Infield St
- 926 Hart St
- 916 Hart St
- 1265 Lindley St
- 45 Stevens St Unit 3L
- 329 Ezra St
- 355 Chamberlain Ave
- 457 Summit St
- 403 Indian Ave
- 355 Exeter St
- 213 Exeter St
- 219 Exeter St
- 245 Indian Ave
- 474 Indian Ave
- 936 Lindley St
- 208 Fairview Ave Unit 210
- 25 Westfield Ave
- 235 Douglas St
- 3461 Main St
- 45 Polk St
Your Personal Tour Guide
Ask me questions while you tour the home.