349 Hurst Dr Bedford, TX 76022
Estimated Value: $295,000 - $308,000
3
Beds
2
Baths
1,672
Sq Ft
$180/Sq Ft
Est. Value
About This Home
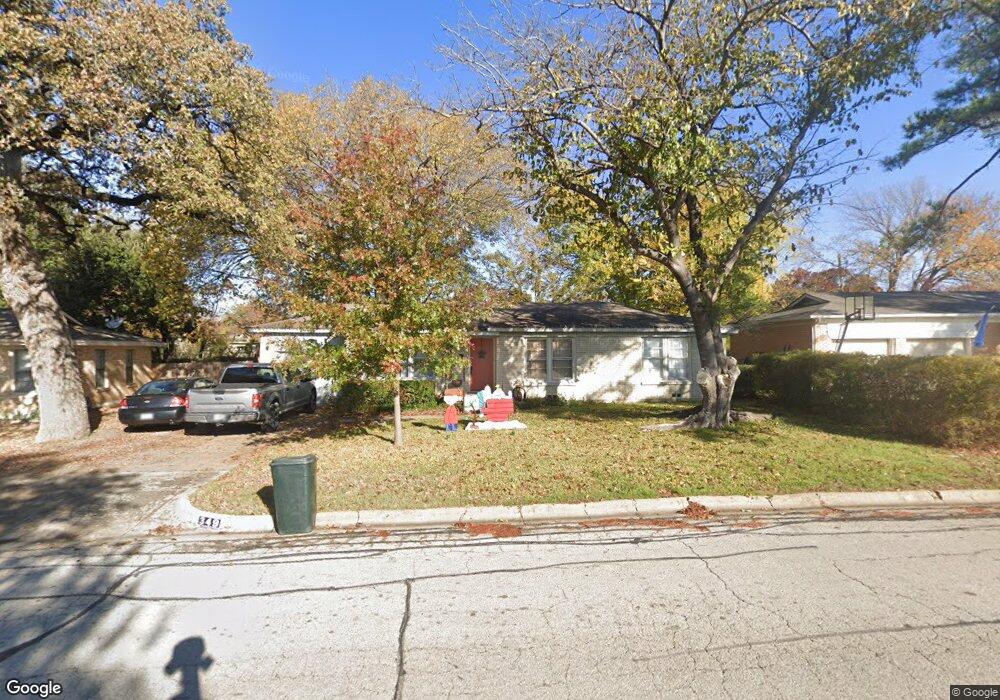
This home is located at 349 Hurst Dr, Bedford, TX 76022 and is currently estimated at $301,090, approximately $180 per square foot. 349 Hurst Dr is a home located in Tarrant County with nearby schools including Stonegate Elementary School, Central J High School, and L.D. Bell High School.
Ownership History
Date
Name
Owned For
Owner Type
Purchase Details
Closed on
Mar 16, 2015
Sold by
Arferro Investments Llc
Bought by
Willis Dimmie
Current Estimated Value
Purchase Details
Closed on
Mar 2, 2015
Sold by
Gonzalez Jennifer Rene
Bought by
Arferro Investments Llc
Purchase Details
Closed on
Feb 2, 2006
Sold by
Mccollum Joy Taylor
Bought by
Elders Taylor Joyce C
Create a Home Valuation Report for This Property
The Home Valuation Report is an in-depth analysis detailing your home's value as well as a comparison with similar homes in the area
Home Values in the Area
Average Home Value in this Area
Purchase History
| Date | Buyer | Sale Price | Title Company |
|---|---|---|---|
| Willis Dimmie | -- | None Available | |
| Arferro Investments Llc | -- | Providence Title Co | |
| Elders Taylor Joyce C | -- | None Available |
Source: Public Records
Tax History Compared to Growth
Tax History
| Year | Tax Paid | Tax Assessment Tax Assessment Total Assessment is a certain percentage of the fair market value that is determined by local assessors to be the total taxable value of land and additions on the property. | Land | Improvement |
|---|---|---|---|---|
| 2025 | $5,525 | $283,781 | $55,000 | $228,781 |
| 2024 | $5,085 | $283,781 | $55,000 | $228,781 |
| 2023 | $5,085 | $265,138 | $35,000 | $230,138 |
| 2022 | $4,975 | $227,759 | $35,000 | $192,759 |
| 2021 | $5,208 | $221,078 | $35,000 | $186,078 |
| 2020 | $4,176 | $175,653 | $35,000 | $140,653 |
| 2019 | $4,096 | $168,605 | $35,000 | $133,605 |
| 2018 | $3,332 | $137,156 | $16,000 | $121,156 |
| 2017 | $3,318 | $137,167 | $16,000 | $121,167 |
| 2016 | $2,873 | $118,774 | $16,000 | $102,774 |
| 2015 | $2,356 | $93,800 | $15,000 | $78,800 |
| 2014 | $2,356 | $93,800 | $15,000 | $78,800 |
Source: Public Records
Map
Nearby Homes
- 341 Hurst Dr
- 344 Bedford Ct E
- 905 Brown Trail
- 1008 Russell Ln
- 849 Russell Ln
- 1112 Ann St
- 803 Glenda Dr
- 802 Brown Trail
- 501 Merrill Dr
- 933 Wade Dr
- 1236 King Dr
- 1108 Wade Dr
- 1136 Simpson Dr
- 604 Donna Ln
- 832 Chateau Valee Cir
- 1220 Norwood Dr
- 49 Coffee Tavern Rd
- 1016 Keith Dr
- 116 Oakhurst Dr
- 716 E Pecan St Unit 716 - 722