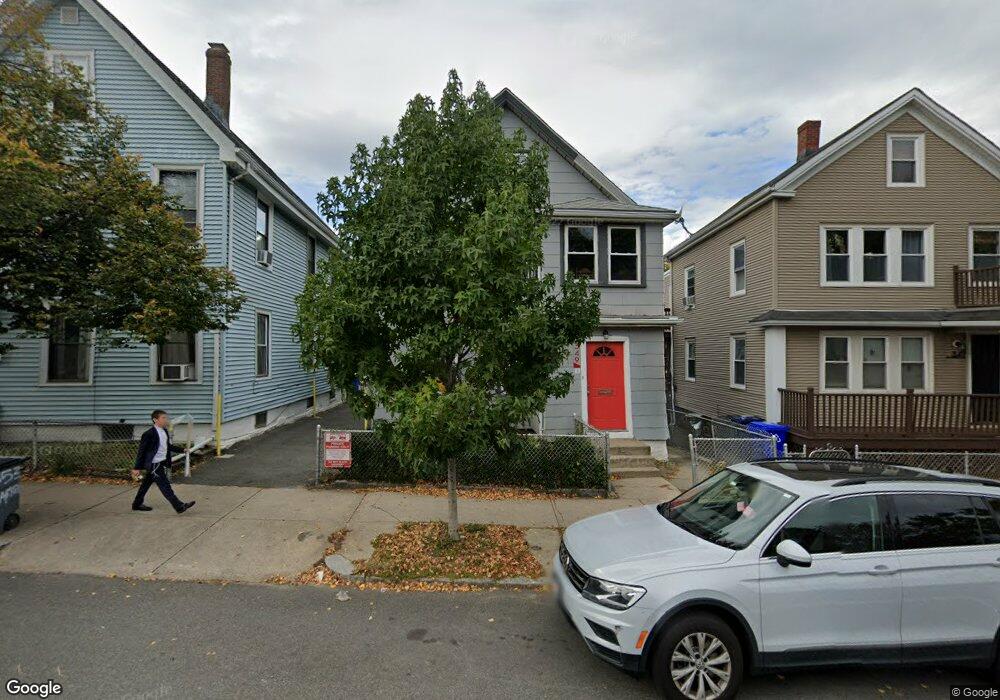
349 Market St Brighton, MA 02135
Brighton NeighborhoodEstimated Value: $848,680 - $1,010,000
3
Beds
1
Bath
1,844
Sq Ft
$497/Sq Ft
Est. Value
About This Home
New Construction and No Broker Fee!! Nothing comes close to this for September 1st. Contact EDGE for more information on this listing, and hundreds of our other listings! See why more people are choosing the highest and most-reviewed real estate firm in Massachusetts. Brokerage fee applies. EDGE Realty Advisors is not liable for any errors, omissions, or changes to terms and conditions of this rental.
Ownership History
Date
Name
Owned For
Owner Type
Purchase Details
Closed on
Jul 18, 2013
Sold by
Cheung Chen L and Cheung Sealin
Bought by
Chan Kin L
Current Estimated Value
Home Financials for this Owner
Home Financials are based on the most recent Mortgage that was taken out on this home.
Original Mortgage
$294,400
Outstanding Balance
$214,072
Interest Rate
3.92%
Mortgage Type
New Conventional
Estimated Equity
$702,098
Purchase Details
Closed on
Sep 7, 1989
Sold by
Krinsky Richard
Bought by
Cheung Chen L
Create a Home Valuation Report for This Property
The Home Valuation Report is an in-depth analysis detailing your home's value as well as a comparison with similar homes in the area
Home Values in the Area
Average Home Value in this Area
Purchase History
| Date | Buyer | Sale Price | Title Company |
|---|---|---|---|
| Chan Kin L | $368,000 | -- | |
| Chan Kin L | $368,000 | -- | |
| Cheung Chen L | $149,000 | -- |
Source: Public Records
Mortgage History
| Date | Status | Borrower | Loan Amount |
|---|---|---|---|
| Open | Chan Kin L | $294,400 | |
| Closed | Chan Kin L | $294,400 | |
| Previous Owner | Cheung Chen L | $75,000 | |
| Previous Owner | Cheung Chen L | $115,000 | |
| Previous Owner | Cheung Chen L | $116,000 | |
| Previous Owner | Cheung Chen L | $116,000 |
Source: Public Records
Property History
| Date | Event | Price | List to Sale | Price per Sq Ft |
|---|---|---|---|---|
| 02/10/2025 02/10/25 | Off Market | -- | -- | -- |
| 01/14/2025 01/14/25 | For Rent | -- | -- | -- |
Tax History Compared to Growth
Tax History
| Year | Tax Paid | Tax Assessment Tax Assessment Total Assessment is a certain percentage of the fair market value that is determined by local assessors to be the total taxable value of land and additions on the property. | Land | Improvement |
|---|---|---|---|---|
| 2025 | $7,680 | $663,200 | $257,600 | $405,600 |
| 2024 | $6,802 | $624,000 | $251,900 | $372,100 |
| 2023 | $6,506 | $605,800 | $244,500 | $361,300 |
| 2022 | $5,992 | $550,700 | $222,300 | $328,400 |
| 2021 | $5,418 | $507,800 | $209,700 | $298,100 |
| 2020 | $5,115 | $484,400 | $172,300 | $312,100 |
| 2019 | $4,907 | $465,600 | $146,000 | $319,600 |
| 2018 | $4,604 | $439,300 | $146,000 | $293,300 |
| 2017 | $4,429 | $418,200 | $146,000 | $272,200 |
| 2016 | $4,381 | $398,300 | $146,000 | $252,300 |
| 2015 | $3,995 | $329,900 | $137,100 | $192,800 |
| 2014 | $3,700 | $294,100 | $137,100 | $157,000 |
Source: Public Records
Map
Nearby Homes
- 10 Waldo Terrace
- 6 Harriet St
- 23 Winship St Unit 2
- 30 Dighton St
- 77 Bennett St Unit 2
- 36-38 Gardena St
- 74 Elmira St
- 87-89 Bennett St
- 11 Faneuil St
- 214 Market St Unit 405
- 214 Market St Unit 201
- 56 Winship St Unit 302
- 230 Washington St Unit 1
- 230 Washington St Unit 2
- 230 Washington St Unit 6
- 230 Washington St Unit 3
- 230 Washington St Unit 10
- 230 Washington St Unit 7
- 230 Washington St Unit 9
- 461 Washington St Unit 301
- 349 Market St
- 349 Market St Unit 349
- 349 Market St Unit 3
- 349 Market St Unit 2
- 349 Market St Unit 1
- 353 Market St
- 353 Market St Unit 204
- 353 Market St Unit 406
- 353 Market St
- 353 Market St Unit 5F-4
- 353 Market St Unit 2
- 353 Market St Unit 1
- 347 Market St
- 347 Market St
- 347 Market St Unit 2
- 347 Market St Unit 1
- 355 Market St Unit 359
- 355 Market St Unit 302
- 355-359 Market St
- 355-1 Market St Unit 355