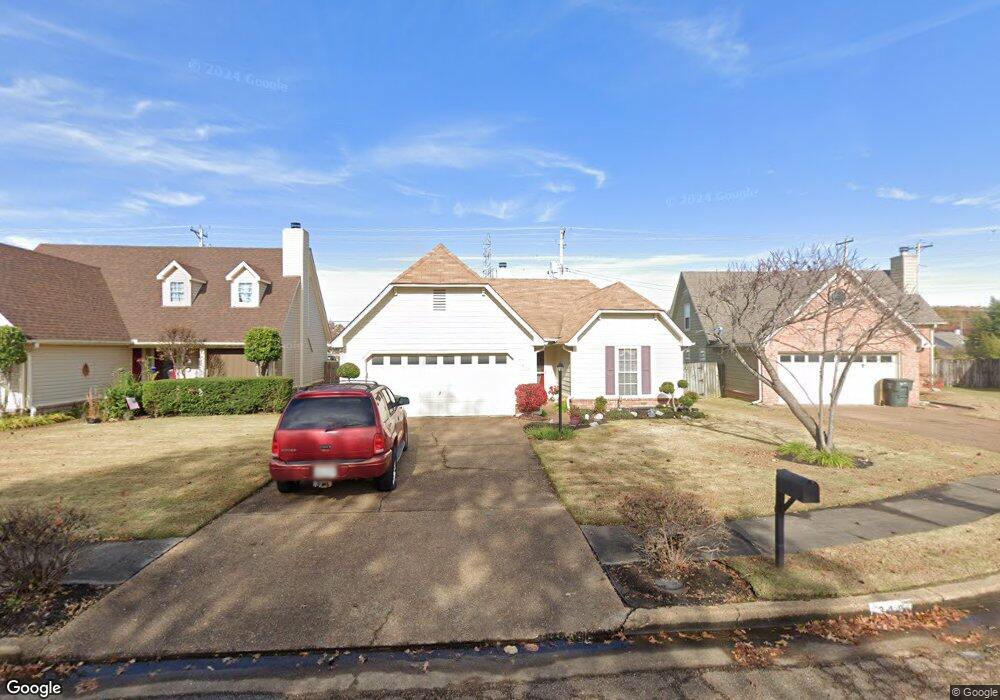
349 Port Douglas Cove Cordova, TN 38018
Cordova NeighborhoodEstimated Value: $214,000 - $246,000
About This Home
Please note, our homes are available on a first-come, first-serve basis and are not reserved until the lease is signed by all applicants and security deposits are collected.
This home features Progress Smart Home - Progress Residential's smart home app, which allows you to control the home securely from any of your devices. Learn more at
Want to tour on your own? Click the “Self Tour” button on this home’s listing or call to register for a self-guided showing at a time that works best for you.
This rental home in Cordova, TN is a 1,276-square-foot property with three bedrooms and two bathrooms. When you step through the front door and into the living room, you'll immediately notice the vaulted ceiling and laminate flooring. Also, take note of the built-in fireplace that creates an inviting atmosphere perfect for hosting guests. Then, head into the kitchen where the pantry offers plenty of storage space for your kitchen staples. Finally, visit the main bedroom, which has a vaulted ceiling and with a fan. Enjoy having a walk-in closet as well as an en suite bathroom. Schedule your viewing appointment today.
Ownership History
Purchase Details
Purchase Details
Home Values in the Area
Average Home Value in this Area
Purchase History
| Date | Buyer | Sale Price | Title Company |
|---|---|---|---|
| Yamasa Co Ltd | $177,000 | Foundation Title & Escrow | |
| Atlas Capital Inc | $135,000 | Foundation Title |
Property History
| Date | Event | Price | List to Sale | Price per Sq Ft |
|---|---|---|---|---|
| 11/09/2024 11/09/24 | Off Market | $1,585 | -- | -- |
| 10/30/2024 10/30/24 | Price Changed | $1,585 | -1.9% | $1 / Sq Ft |
| 10/25/2024 10/25/24 | Price Changed | $1,615 | -2.1% | $1 / Sq Ft |
| 10/22/2024 10/22/24 | Price Changed | $1,650 | -0.9% | $1 / Sq Ft |
| 10/19/2024 10/19/24 | Price Changed | $1,665 | -1.2% | $1 / Sq Ft |
| 10/15/2024 10/15/24 | Price Changed | $1,685 | +0.9% | $1 / Sq Ft |
| 10/14/2024 10/14/24 | Price Changed | $1,670 | -0.6% | $1 / Sq Ft |
| 10/13/2024 10/13/24 | Price Changed | $1,680 | -0.3% | $1 / Sq Ft |
| 10/11/2024 10/11/24 | Price Changed | $1,685 | -26.4% | $1 / Sq Ft |
| 10/05/2024 10/05/24 | For Rent | $2,290 | +36.3% | -- |
| 09/21/2024 09/21/24 | Price Changed | $1,680 | -0.3% | $1 / Sq Ft |
| 09/20/2024 09/20/24 | Price Changed | $1,685 | -- | $1 / Sq Ft |
Tax History Compared to Growth
Tax History
| Year | Tax Paid | Tax Assessment Tax Assessment Total Assessment is a certain percentage of the fair market value that is determined by local assessors to be the total taxable value of land and additions on the property. | Land | Improvement |
|---|---|---|---|---|
| 2025 | $1,125 | $53,875 | $11,250 | $42,625 |
| 2024 | $1,125 | $33,175 | $6,750 | $26,425 |
| 2023 | $1,968 | $33,175 | $6,750 | $26,425 |
| 2022 | $1,968 | $33,175 | $6,750 | $26,425 |
| 2021 | $1,988 | $33,175 | $6,750 | $26,425 |
| 2020 | $2,025 | $27,950 | $6,750 | $21,200 |
| 2019 | $1,976 | $27,950 | $6,750 | $21,200 |
| 2018 | $1,976 | $27,950 | $6,750 | $21,200 |
| 2017 | $1,149 | $27,950 | $6,750 | $21,200 |
| 2016 | $1,142 | $26,125 | $0 | $0 |
| 2014 | $1,101 | $26,125 | $0 | $0 |
Map
- 218 S Walnut Bend Rd
- 250 Bendigo Dr
- 8228 Planters Grove Dr
- 337 Almstead Cove
- 402 Lillehammer Cove
- 8225 Walnut Grove Rd
- 90 W Viking Dr
- 00 Walnut Grove Rd
- 241 Ericson Rd
- 8488 Loften Cove
- 8492 Loften Cove
- 11 W Viking Dr
- 1506 Wolf Bend Rd
- 167 Ericson Rd
- 334 Brook Ridge Dr
- 283 Walnut Tree Cove
- 179 Mysen Cir
- 439 Spruce Glen Dr
- 178 Mysen Cir
- 7641 Charstone Dr
- 353 Port Douglas Cove
- 347 Port Douglas Cove
- 355 Port Douglas Cove
- 8032 Port Douglas Dr
- 350 Port Douglas Cove
- 357 Port Douglas Cove
- 8035 Port Douglas Dr
- 8036 Port Douglas Dr
- 359 Port Douglas Cove
- 354 Port Douglas Cove
- 8045 German Creek Dr
- 8050 Port Douglas Dr
- 8043 Port Douglas Dr
- 364 Port Douglas Cove
- 8047 German Creek Dr
- 358 Port Douglas Cove
- 360 Port Douglas Cove
- 8044 Port Douglas Dr
- 8045 Port Douglas Dr
- 8051 German Creek Dr