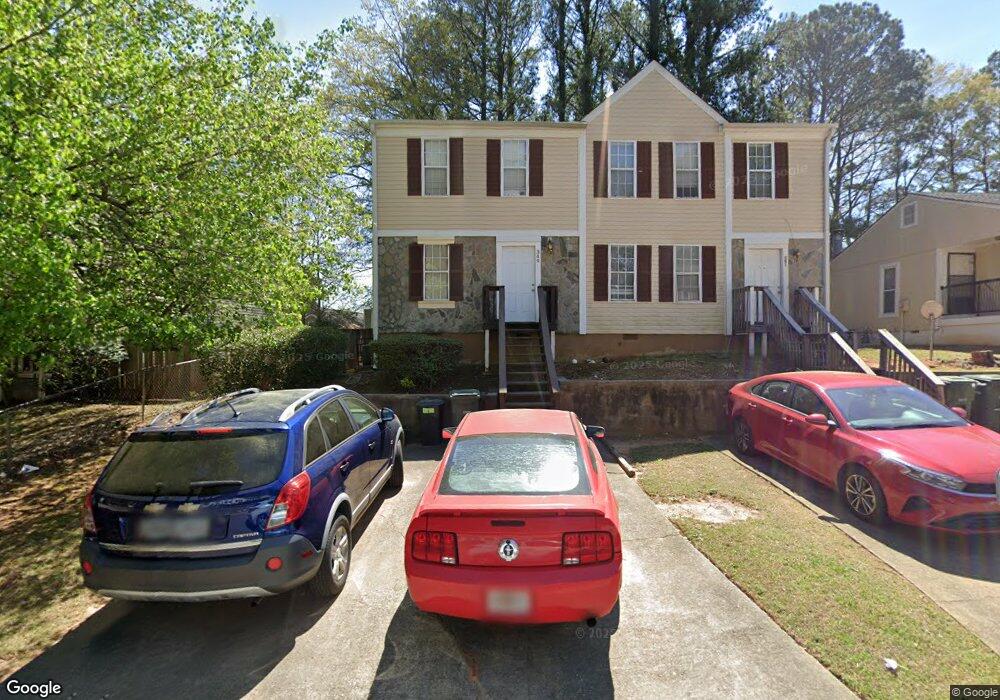
349 W Post Oak Crossing SW Unit 349 Marietta, GA 30008
Southwestern Marietta NeighborhoodEstimated Value: $187,000 - $212,762
2
Beds
3
Baths
1,152
Sq Ft
$178/Sq Ft
Est. Value
About This Home
This home is located at 349 W Post Oak Crossing SW Unit 349, Marietta, GA 30008 and is currently estimated at $204,691, approximately $177 per square foot. 349 W Post Oak Crossing SW Unit 349 is a home located in Cobb County with nearby schools including Dunleith Elementary School, Marietta Sixth Grade Academy, and Marietta Middle School.
Ownership History
Date
Name
Owned For
Owner Type
Purchase Details
Closed on
Apr 11, 2019
Sold by
Wright Terron G
Bought by
Cobb Oak Properties Llc
Current Estimated Value
Purchase Details
Closed on
Jan 28, 2005
Sold by
Federal National Mortgage Association
Bought by
Wright Terron G
Home Financials for this Owner
Home Financials are based on the most recent Mortgage that was taken out on this home.
Original Mortgage
$67,500
Interest Rate
5.66%
Mortgage Type
New Conventional
Purchase Details
Closed on
Sep 7, 2004
Sold by
Johnson Brandon
Bought by
Mortgage Electronic Registrati
Purchase Details
Closed on
Oct 16, 2001
Sold by
Brooks J D
Bought by
Johnson Brandon
Home Financials for this Owner
Home Financials are based on the most recent Mortgage that was taken out on this home.
Original Mortgage
$76,500
Interest Rate
6.67%
Mortgage Type
New Conventional
Create a Home Valuation Report for This Property
The Home Valuation Report is an in-depth analysis detailing your home's value as well as a comparison with similar homes in the area
Home Values in the Area
Average Home Value in this Area
Purchase History
| Date | Buyer | Sale Price | Title Company |
|---|---|---|---|
| Cobb Oak Properties Llc | $94,500 | -- | |
| Wright Terron G | $202,500 | -- | |
| Mortgage Electronic Registrati | $64,673 | -- | |
| Johnson Brandon | $85,000 | -- |
Source: Public Records
Mortgage History
| Date | Status | Borrower | Loan Amount |
|---|---|---|---|
| Previous Owner | Wright Terron G | $67,500 | |
| Previous Owner | Johnson Brandon | $76,500 |
Source: Public Records
Tax History Compared to Growth
Tax History
| Year | Tax Paid | Tax Assessment Tax Assessment Total Assessment is a certain percentage of the fair market value that is determined by local assessors to be the total taxable value of land and additions on the property. | Land | Improvement |
|---|---|---|---|---|
| 2025 | $693 | $81,920 | $26,000 | $55,920 |
| 2024 | $693 | $81,920 | $26,000 | $55,920 |
| 2023 | $571 | $67,444 | $22,000 | $45,444 |
| 2022 | $347 | $41,024 | $11,200 | $29,824 |
| 2021 | $352 | $41,024 | $11,200 | $29,824 |
| 2020 | $312 | $36,264 | $11,200 | $25,064 |
| 2019 | $312 | $36,264 | $11,200 | $25,064 |
| 2018 | $296 | $34,508 | $10,000 | $24,508 |
| 2017 | $170 | $24,728 | $6,000 | $18,728 |
| 2016 | $123 | $17,920 | $2,000 | $15,920 |
| 2015 | $134 | $17,920 | $2,000 | $15,920 |
| 2014 | $84 | $10,872 | $0 | $0 |
Source: Public Records
Map
Nearby Homes
- 1166 Booth Rd SW Unit 407
- 1166 Booth Rd SW Unit 205
- 1166 Booth Rd SW Unit 906
- 1166 Booth Rd SW Unit 908
- 1166 Booth Rd SW Unit 610
- 264 Juliet Ln SW
- 105 Grampian Ct Unit 13
- 150 Creighton Ln
- 1479 Bellemeade Farms Rd SW
- 393 Cedar Trace SW Unit 1
- 1278 Houndslake Dr
- 1239 Grampian Pass Unit 11
- 1230 Arden Dr SW
- 1252 Grampian Pass Unit 9
- 141 Dunleith Pkwy SW
- 1485 Brandon Dr SW
- 1048 Brownstone Dr Unit 3
- 243 Brownstone Cir Unit 25
- 349 W Post Oak Crossing SW
- 345 W Post Oak Crossing SW Unit 2006
- 345 W Post Oak Crossing SW Unit 345
- 355 W Post Oak Crossing SW
- W W Post Oak Crossing SW
- 357 W Post Oak Crossing SW
- 341 W Post Oak Crossing SW Unit 341
- 341 W Post Oak Crossing SW
- 341 W Post Oak Crossing SW Unit 2
- 1250 W Booth Road Extension SW Unit 2
- 1254 W Booth Road Extension SW
- 1254 W Booth Road Extension SW Unit 151
- 1254 W Booth Road Extension SW
- 350 W Post Oak Crossing SW
- 1254 SW W Booth Rd Extension SW Unit 151
- 361 W Post Oak Crossing SW
- 354 W Post Oak Crossing SW
- 344 W Post Oak Crossing SW
- 358 W Post Oak Crossing SW Unit 4
- 365 W Post Oak Crossing SW Unit 4