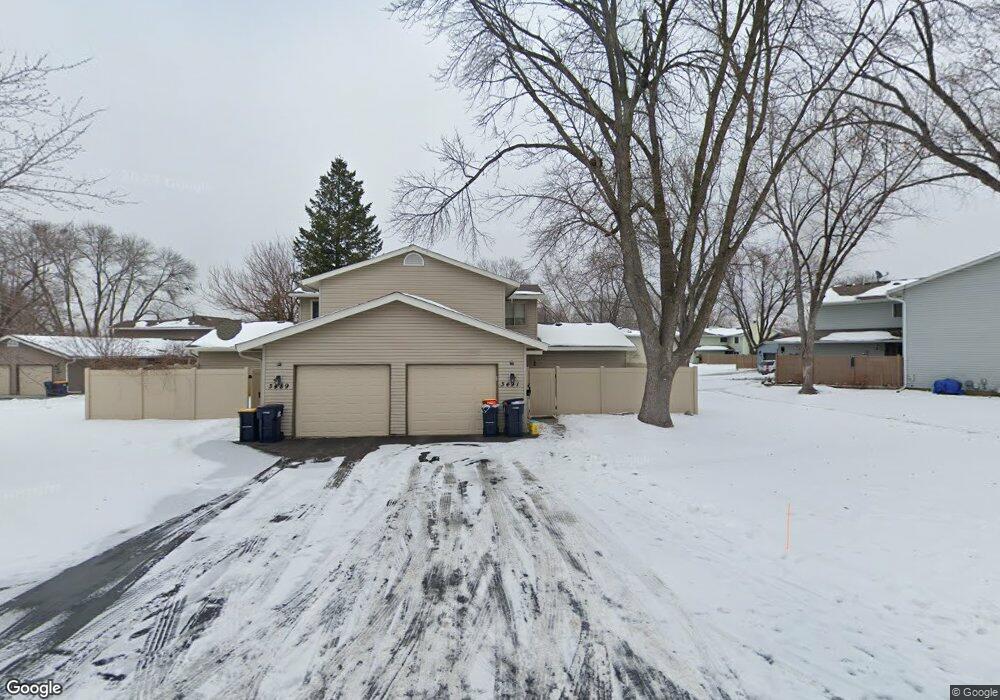
3491 67th St E Unit 84 Inver Grove Heights, MN 55076
Estimated Value: $174,125 - $202,000
2
Beds
1
Bath
936
Sq Ft
$199/Sq Ft
Est. Value
About This Home
This home is located at 3491 67th St E Unit 84, Inver Grove Heights, MN 55076 and is currently estimated at $186,531, approximately $199 per square foot. 3491 67th St E Unit 84 is a home located in Dakota County with nearby schools including Hilltop Elementary School, Inver Grove Heights Middle School, and Simley Senior High School.
Ownership History
Date
Name
Owned For
Owner Type
Purchase Details
Closed on
Sep 26, 2016
Sold by
Liddicoat Sarah J and Liddicoat Ryan
Bought by
Connor Jr John O
Current Estimated Value
Home Financials for this Owner
Home Financials are based on the most recent Mortgage that was taken out on this home.
Original Mortgage
$127,205
Outstanding Balance
$101,882
Interest Rate
3.43%
Mortgage Type
New Conventional
Estimated Equity
$84,650
Purchase Details
Closed on
Jul 15, 2003
Sold by
Gingerich Matthew A and Gingerich Molly
Bought by
Tallackson Sarah
Purchase Details
Closed on
Jul 27, 2000
Sold by
Arme Jessica L and Arme Charr P
Bought by
Gingerich Matthew A and Gingerich Molly R
Purchase Details
Closed on
Aug 3, 1998
Sold by
Mcglauflin Franklin C and Mcglauflin Helen E
Bought by
Pietsch Jessica L and Arme Charr P
Create a Home Valuation Report for This Property
The Home Valuation Report is an in-depth analysis detailing your home's value as well as a comparison with similar homes in the area
Home Values in the Area
Average Home Value in this Area
Purchase History
| Date | Buyer | Sale Price | Title Company |
|---|---|---|---|
| Connor Jr John O | $133,900 | Titlesmart Inc | |
| Tallackson Sarah | $129,900 | -- | |
| Gingerich Matthew A | $95,000 | -- | |
| Pietsch Jessica L | $58,500 | -- |
Source: Public Records
Mortgage History
| Date | Status | Borrower | Loan Amount |
|---|---|---|---|
| Open | Connor Jr John O | $127,205 |
Source: Public Records
Tax History Compared to Growth
Tax History
| Year | Tax Paid | Tax Assessment Tax Assessment Total Assessment is a certain percentage of the fair market value that is determined by local assessors to be the total taxable value of land and additions on the property. | Land | Improvement |
|---|---|---|---|---|
| 2024 | $1,354 | $153,000 | $24,700 | $128,300 |
| 2023 | $1,354 | $151,100 | $24,900 | $126,200 |
| 2022 | $1,224 | $150,000 | $24,900 | $125,100 |
| 2021 | $1,132 | $131,700 | $21,600 | $110,100 |
| 2020 | $1,074 | $122,200 | $20,600 | $101,600 |
| 2019 | $1,046 | $117,400 | $19,600 | $97,800 |
| 2018 | $960 | $109,200 | $18,100 | $91,100 |
| 2017 | $823 | $101,400 | $16,800 | $84,600 |
| 2016 | $1,078 | $90,700 | $16,000 | $74,700 |
| 2015 | $1,112 | $85,100 | $15,200 | $69,900 |
| 2014 | -- | $83,400 | $14,000 | $69,400 |
| 2013 | -- | $76,500 | $12,900 | $63,600 |
Source: Public Records
Map
Nearby Homes
- 3481 Cloman Way E
- 3548 Cloman Way
- 3580 68th St E
- 6951 Clay Ave
- 6445 Coryell Ct
- TBD 65th St E
- 7134 Claude Ave
- 7169 Clay Ave
- 6280 Carleda Way
- 6435 Dawn Way
- 4020 64th St E
- 7393 Clayton Ave
- 6050 Cahill Ave
- 7459 Carmen Ave
- Virginia Plan at Eagles Landing
- Cottonwood II Plan at Eagles Landing
- Enclave II Plan at Eagles Landing
- Macalaster Plan at Eagles Landing
- Bismarck Plan at Eagles Landing
- Tennessee Plan at Eagles Landing
- 3411 67th St E Unit 66
- 3491 67th St E
- 3458 Cloman Way Unit 82
- 3460 Cloman Way Unit 81
- 3481 67th St E Unit 80
- 3469 67th St E
- 3439 67th St E Unit 73
- 3429 67th St E
- 3438 Cloman Way Unit 70
- 3421 67th St E
- 3419 67th St E Unit 67
- 3411 67th St E
- 3409 67th St E
- 3420 Cloman Way
- 3393 67th St E
- 6692 Catherine Ave
- 3360 Cloman Way
- 6682 Catherine Ave
- 3393 67th St E Unit 51
- 3429 67th St E Unit 71