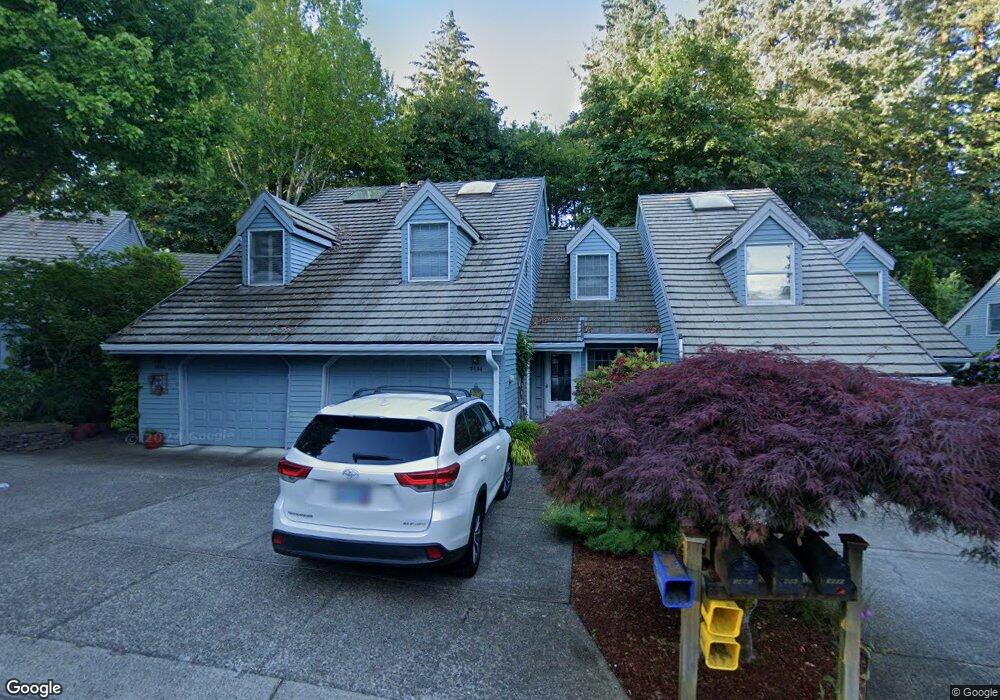
3496 Devonshire Dr Lake Oswego, OR 97035
Lake Grove NeighborhoodEstimated Value: $624,000 - $849,000
3
Beds
2
Baths
1,556
Sq Ft
$450/Sq Ft
Est. Value
About This Home
This home is located at 3496 Devonshire Dr, Lake Oswego, OR 97035 and is currently estimated at $699,548, approximately $449 per square foot. 3496 Devonshire Dr is a home located in Clackamas County with nearby schools including Forest Hills Elementary School, Lake Oswego Junior High School, and Lake Oswego Senior High School.
Ownership History
Date
Name
Owned For
Owner Type
Purchase Details
Closed on
Sep 18, 2003
Sold by
Pagni David A and Mazzocco Kathleen
Bought by
Collard Debora E
Current Estimated Value
Home Financials for this Owner
Home Financials are based on the most recent Mortgage that was taken out on this home.
Original Mortgage
$195,500
Outstanding Balance
$90,335
Interest Rate
6.3%
Mortgage Type
Purchase Money Mortgage
Estimated Equity
$609,213
Purchase Details
Closed on
Sep 9, 1997
Sold by
Winge Jean L
Bought by
Pagni David A and Mazzocco Kathleen
Purchase Details
Closed on
Jul 27, 1995
Sold by
Hardesty Jean L and Winge Jean L
Bought by
Winge Jean L and Jean Winge Revocable Living Trust
Purchase Details
Closed on
Jun 5, 1995
Sold by
Winge Thomas W
Bought by
Winge Thomas W and Thomas Winge Revocable Living Trust
Create a Home Valuation Report for This Property
The Home Valuation Report is an in-depth analysis detailing your home's value as well as a comparison with similar homes in the area
Home Values in the Area
Average Home Value in this Area
Purchase History
| Date | Buyer | Sale Price | Title Company |
|---|---|---|---|
| Collard Debora E | $245,200 | Ticor Title Insurance Compan | |
| Pagni David A | $205,000 | First American Title Ins Co | |
| Winge Jean L | -- | -- | |
| Winge Thomas W | -- | -- |
Source: Public Records
Mortgage History
| Date | Status | Borrower | Loan Amount |
|---|---|---|---|
| Open | Collard Debora E | $195,500 | |
| Closed | Collard Debora E | $25,000 |
Source: Public Records
Tax History
| Year | Tax Paid | Tax Assessment Tax Assessment Total Assessment is a certain percentage of the fair market value that is determined by local assessors to be the total taxable value of land and additions on the property. | Land | Improvement |
|---|---|---|---|---|
| 2025 | $5,859 | $305,109 | -- | -- |
| 2024 | $5,703 | $296,223 | -- | -- |
| 2023 | $5,703 | $287,596 | $0 | $0 |
| 2022 | $5,371 | $279,220 | $0 | $0 |
| 2021 | $4,961 | $271,088 | $0 | $0 |
| 2020 | $4,836 | $263,193 | $0 | $0 |
| 2019 | $4,717 | $255,528 | $0 | $0 |
| 2018 | $4,486 | $248,085 | $0 | $0 |
| 2017 | $4,329 | $240,859 | $0 | $0 |
| 2016 | $3,941 | $233,844 | $0 | $0 |
Source: Public Records
Map
Nearby Homes
- 3676 Spring Ln
- 15003 Twin Fir Rd
- 15370 Twin Fir Rd
- 3537 Lake Grove Ave
- 3696 Carman Dr
- 3525 Lake Grove Ave
- 3 Hotspur St
- 3850 Lake Grove Ave
- 3884 Lake Grove Ave
- 3853 Carman Dr
- 4225 Oakridge Rd
- 15628 Quarry Rd
- 2 Falstaff St
- 16038 Reese Rd
- 16 Othello St
- 2560 Glen Eagles Place
- 3926 Carman Dr
- 14595 Sherbrook Place
- 4000 Carman Dr Unit E-68 Dr
- 4000 Carman Dr Unit E-68
- 3492 Devonshire Dr
- 3500 Devonshire Dr
- 3488 Devonshire Dr
- 15205 Boones Way
- 3484 Devonshire Dr
- 15225 Boones Way
- 3501 Devonshire Dr
- 3480 Devonshire Dr
- 3493 Devonshire Dr
- 3476 Devonshire Dr
- 3489 Devonshire Dr
- 15235 Boones Way
- 15250 Boones Way
- 3477 Devonshire Dr
- 3485 Devonshire Dr
- 15252 Boones Way
- 3481 Devonshire Dr
- 15245 Boones Way
- 15254 Boones Way
- 15301 Twin Fir Rd
Your Personal Tour Guide
Ask me questions while you tour the home.