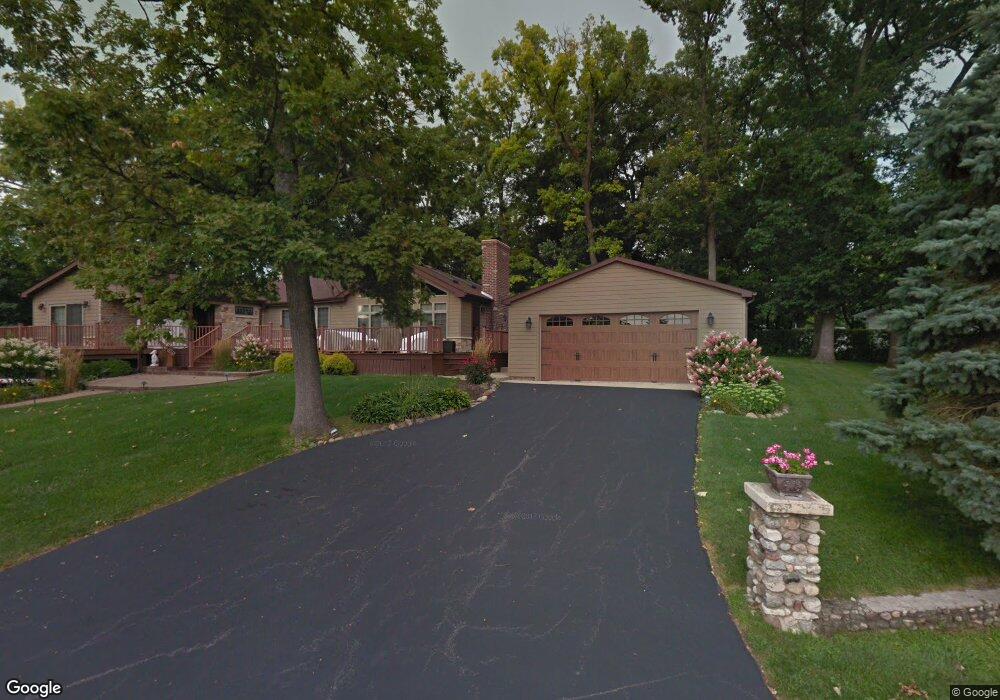
34964 Paupukkewis Trail McHenry, IL 60051
East Palm Beach NeighborhoodEstimated Value: $303,000 - $684,582
3
Beds
2
Baths
1,980
Sq Ft
$247/Sq Ft
Est. Value
About This Home
This home is located at 34964 Paupukkewis Trail, McHenry, IL 60051 and is currently estimated at $488,396, approximately $246 per square foot. 34964 Paupukkewis Trail is a home located in Lake County with nearby schools including Big Hollow Primary School, Big Hollow Elementary School, and Big Hollow Middle School.
Ownership History
Date
Name
Owned For
Owner Type
Purchase Details
Closed on
Mar 29, 2007
Sold by
Pohlman Christopher J and Pohlman Charles
Bought by
Lynch Mark and Lynch Deborah
Current Estimated Value
Home Financials for this Owner
Home Financials are based on the most recent Mortgage that was taken out on this home.
Original Mortgage
$253,000
Outstanding Balance
$153,391
Interest Rate
6.2%
Mortgage Type
Unknown
Estimated Equity
$335,005
Purchase Details
Closed on
Aug 28, 1998
Sold by
State Bank Of The Lakes
Bought by
Pohlman Corwin H
Home Financials for this Owner
Home Financials are based on the most recent Mortgage that was taken out on this home.
Original Mortgage
$90,000
Interest Rate
7.02%
Purchase Details
Closed on
Sep 1, 1996
Sold by
Pohlman Corwin H
Bought by
State Bank Of The Lakes
Create a Home Valuation Report for This Property
The Home Valuation Report is an in-depth analysis detailing your home's value as well as a comparison with similar homes in the area
Home Values in the Area
Average Home Value in this Area
Purchase History
| Date | Buyer | Sale Price | Title Company |
|---|---|---|---|
| Lynch Mark | $353,000 | None Available | |
| Pohlman Corwin H | -- | Chicago Title Insurance Co | |
| State Bank Of The Lakes | -- | -- |
Source: Public Records
Mortgage History
| Date | Status | Borrower | Loan Amount |
|---|---|---|---|
| Open | Lynch Mark | $253,000 | |
| Previous Owner | Pohlman Corwin H | $90,000 |
Source: Public Records
Tax History Compared to Growth
Tax History
| Year | Tax Paid | Tax Assessment Tax Assessment Total Assessment is a certain percentage of the fair market value that is determined by local assessors to be the total taxable value of land and additions on the property. | Land | Improvement |
|---|---|---|---|---|
| 2024 | $11,864 | $195,918 | $40,806 | $155,112 |
| 2023 | $12,120 | $161,492 | $38,442 | $123,050 |
| 2022 | $12,120 | $143,177 | $48,510 | $94,667 |
| 2021 | $11,947 | $134,958 | $45,725 | $89,233 |
| 2020 | $11,916 | $133,029 | $45,071 | $87,958 |
| 2019 | $12,007 | $133,029 | $43,221 | $89,808 |
| 2018 | $9,610 | $105,031 | $30,092 | $74,939 |
| 2017 | $9,200 | $97,080 | $27,814 | $69,266 |
| 2016 | $9,396 | $88,787 | $25,438 | $63,349 |
| 2015 | $9,110 | $82,854 | $23,738 | $59,116 |
| 2014 | $10,142 | $97,152 | $22,239 | $74,913 |
| 2012 | $10,281 | $98,324 | $21,891 | $76,433 |
Source: Public Records
Map
Nearby Homes
- 28986 W Manitoba Trail
- 34726 Mudjekeewis Trail
- 35116 N Lake Matthews Trail
- 35100 N Indian Trail
- 3233 N Bayview Ln
- 34785 N Gogol Ave
- 2912 N Magellan Dr
- 712 Regner Rd
- 532 Circle Dr
- 177 Eagle Point Rd
- 2813 Regner Rd
- 35403 N 2nd Ave
- Lot 2 Pitzen Rd
- 1370 U S 12
- 411 Kings Rd
- 520 Bald Knob Rd
- 4018 Pitzen Rd
- 616 Windsor Dr Unit D
- 649 Windsor Dr Unit 3D
- 576 Windsor Dr Unit 370
- 34916 Paupukkewis Trail
- 35008 Paupukkewis Trail
- 34892 Paupukkewis Trail
- 28777 Great Bear Trail
- 35032 Paupukkewis Trail
- 28773 W Manitoba Trail
- 28808 W Manitoba Trail
- 28680 W Channel Dr
- 28826 W Manitoba Trail
- 28792 W Manitoba Trail
- 28761 W Manitoba Trail
- 28730 W White Rabbit Trail
- 34846 Lakeview Ct
- 35062 Paupukkewis Trail
- 28674 W Channel Dr
- 34830 Lakeview Ct
- 34820 Lakeview Ct
- 28844 W Manitoba Trail
- 28731 W Snowshoe Trail
- 28774 W Manitoba Trail