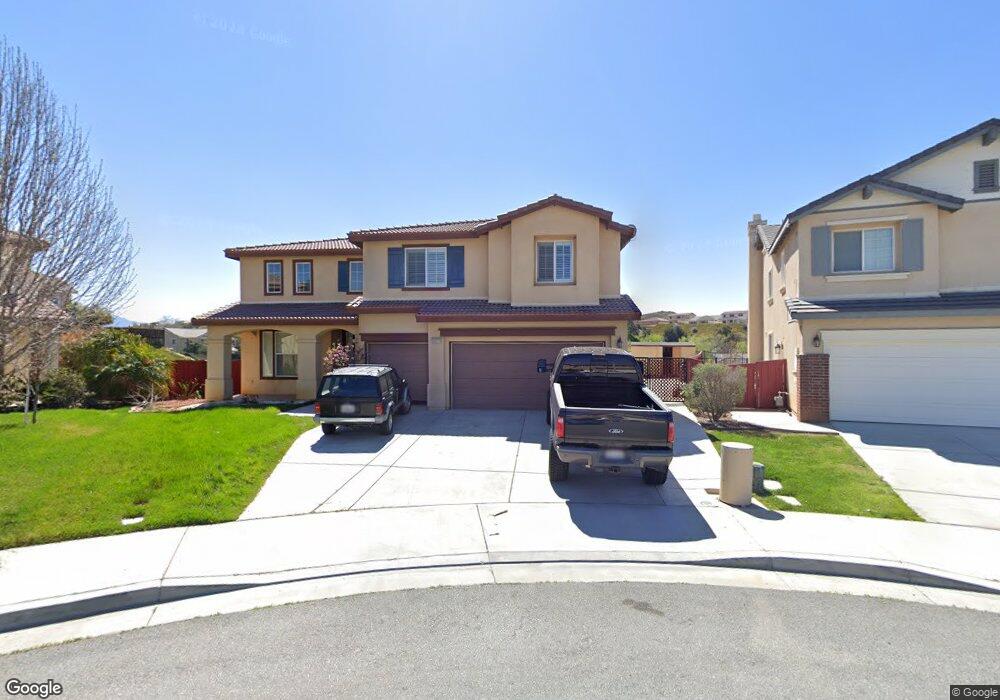
34979 Middlecoff Ct Beaumont, CA 92223
Fairway Canyon NeighborhoodEstimated Value: $632,000 - $693,713
5
Beds
4
Baths
3,830
Sq Ft
$171/Sq Ft
Est. Value
About This Home
This home is located at 34979 Middlecoff Ct, Beaumont, CA 92223 and is currently estimated at $656,428, approximately $171 per square foot. 34979 Middlecoff Ct is a home located in Riverside County with nearby schools including Summerwind Trails and Beaumont Senior High School.
Ownership History
Date
Name
Owned For
Owner Type
Purchase Details
Closed on
Feb 12, 2014
Sold by
Nino Munir I and Nino May M
Bought by
The Nino Family Trust
Current Estimated Value
Purchase Details
Closed on
Oct 11, 2012
Sold by
Nino Munir I and Nino May M
Bought by
Nino Munir and Nino May
Purchase Details
Closed on
Mar 17, 2010
Sold by
Aurora Loan Services Llc
Bought by
Nino Munir I and Nino May M
Purchase Details
Closed on
Feb 1, 2010
Sold by
Yong Lamphone
Bought by
Aurora Loan Services Llc
Purchase Details
Closed on
Mar 4, 2008
Sold by
Yong Lamphone
Bought by
Yong Lamphone and The Lamphone Yong Trust
Purchase Details
Closed on
Jun 30, 2006
Sold by
Fairway Canyon Development Llc
Bought by
Yong Lamphone
Home Financials for this Owner
Home Financials are based on the most recent Mortgage that was taken out on this home.
Original Mortgage
$554,990
Interest Rate
7.37%
Mortgage Type
Purchase Money Mortgage
Create a Home Valuation Report for This Property
The Home Valuation Report is an in-depth analysis detailing your home's value as well as a comparison with similar homes in the area
Home Values in the Area
Average Home Value in this Area
Purchase History
| Date | Buyer | Sale Price | Title Company |
|---|---|---|---|
| The Nino Family Trust | -- | None Available | |
| Nino Munir | -- | None Available | |
| Nino Munir I | $245,000 | Lsi Title Agency | |
| Aurora Loan Services Llc | $517,719 | Accommodation | |
| Yong Lamphone | -- | None Available | |
| Yong Lamphone | $555,000 | North American Title Company |
Source: Public Records
Mortgage History
| Date | Status | Borrower | Loan Amount |
|---|---|---|---|
| Previous Owner | Yong Lamphone | $554,990 |
Source: Public Records
Tax History
| Year | Tax Paid | Tax Assessment Tax Assessment Total Assessment is a certain percentage of the fair market value that is determined by local assessors to be the total taxable value of land and additions on the property. | Land | Improvement |
|---|---|---|---|---|
| 2025 | $7,226 | $316,233 | $77,437 | $238,796 |
| 2023 | $7,226 | $303,955 | $74,431 | $229,524 |
| 2022 | $7,164 | $297,996 | $72,972 | $225,024 |
| 2021 | $7,138 | $292,154 | $71,542 | $220,612 |
| 2020 | $7,267 | $289,159 | $70,809 | $218,350 |
| 2019 | $7,241 | $283,490 | $69,421 | $214,069 |
| 2018 | $7,307 | $277,932 | $68,061 | $209,871 |
| 2017 | $7,537 | $272,483 | $66,727 | $205,756 |
| 2016 | $7,942 | $267,141 | $65,419 | $201,722 |
| 2015 | $7,801 | $263,131 | $64,438 | $198,693 |
| 2014 | $7,724 | $257,978 | $63,177 | $194,801 |
Source: Public Records
Map
Nearby Homes
- 35021 Nicklaus Nook
- 1500 Yucca Ct
- 1512 Yucca Ct
- 11449 Lyle Ln
- 1537 Yucca Ct
- 35256 Thorpe Trail
- 35334 Price St
- 35293 Funk Way
- 11486 Floyd Cir
- 1224 Joshua Tree Rd
- 34641 Irwin St
- 11474 Jacobsen Rd
- 34596 Venturi Ave
- 11052 Picard Place
- 34548 Morris St
- 35590 Byron Trail
- 35357 Hutchison Place
- 1099 Little Leaf St
- 35256 Lopez Ln
- 35344 Couples
- 34987 Middlecoff Ct
- 34967 Middlecoff Ct
- 11361 Harmon Heights
- 11349 Harmon Heights
- 34988 Middlecoff Ct
- 34959 Middlecoff Ct
- 11407 Harmon Heights
- 34976 Middlecoff Ct
- 11337 Harmon Heights
- 34964 Middlecoff Ct
- 34945 Middlecoff Ct
- 11325 Harmon Heights
- 35055 Hogan Dr
- 34952 Middlecoff Ct
- 34950 Miller Place
- 25423 Hogan Dr
- 34511 Hogan Dr
- 34937 Middlecoff Ct
- 35037 Nicklaus Nook
- 34946 Miller Place
Your Personal Tour Guide
Ask me questions while you tour the home.