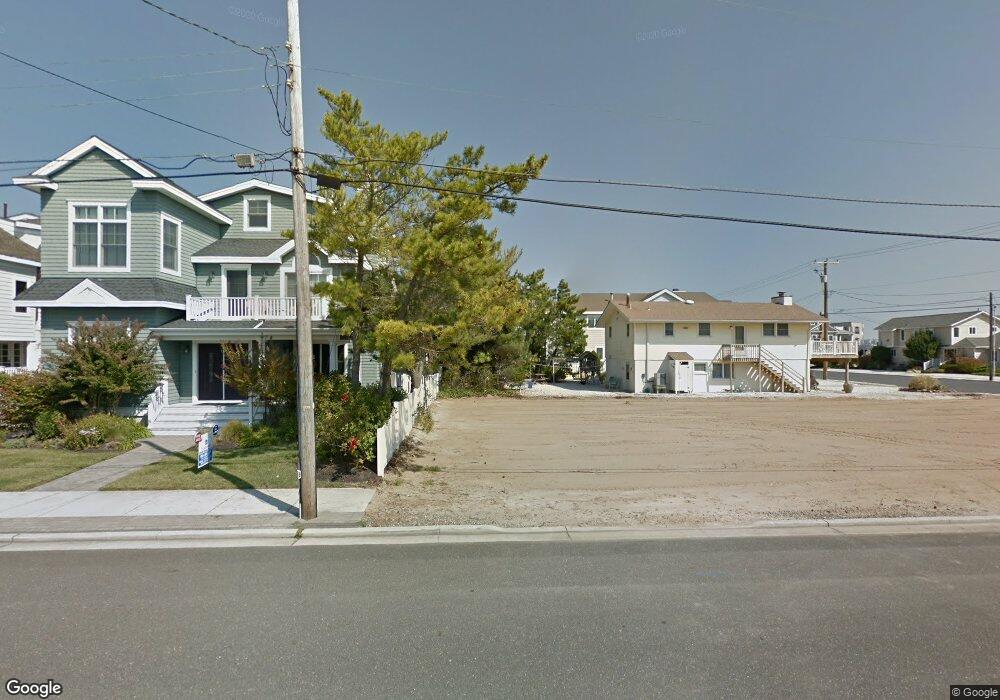
35 10th St W Avalon, NJ 08202
Estimated Value: $3,698,626 - $4,927,000
--
Bed
--
Bath
3,127
Sq Ft
$1,357/Sq Ft
Est. Value
About This Home
This home is located at 35 10th St W, Avalon, NJ 08202 and is currently estimated at $4,244,157, approximately $1,357 per square foot. 35 10th St W is a home located in Cape May County with nearby schools including Avalon Elementary School.
Ownership History
Date
Name
Owned For
Owner Type
Purchase Details
Closed on
Aug 6, 2025
Sold by
Cherkas Cynthia J
Bought by
Cherkas Cynthia J and Cherkas Randolph M
Current Estimated Value
Purchase Details
Closed on
Dec 14, 2011
Sold by
Cherkas Randolph M and Cherkas Cynthia J
Bought by
Cherkas Cynthia J
Purchase Details
Closed on
Sep 25, 2009
Sold by
Turner Deborah A
Bought by
Cherkas Randolph M and Cherkas Cynthia J
Purchase Details
Closed on
Mar 26, 2005
Sold by
Talucci Samuel J and Dave Charlene Talucci
Bought by
Turner Deborah A
Home Financials for this Owner
Home Financials are based on the most recent Mortgage that was taken out on this home.
Original Mortgage
$1,190,000
Interest Rate
5.62%
Mortgage Type
Purchase Money Mortgage
Create a Home Valuation Report for This Property
The Home Valuation Report is an in-depth analysis detailing your home's value as well as a comparison with similar homes in the area
Home Values in the Area
Average Home Value in this Area
Purchase History
| Date | Buyer | Sale Price | Title Company |
|---|---|---|---|
| Cherkas Cynthia J | -- | None Listed On Document | |
| Cherkas Cynthia J | -- | None Available | |
| Cherkas Randolph M | $1,625,000 | None Available | |
| Turner Deborah A | $1,700,000 | -- |
Source: Public Records
Mortgage History
| Date | Status | Borrower | Loan Amount |
|---|---|---|---|
| Previous Owner | Turner Deborah A | $1,190,000 | |
| Closed | Turner Deborah A | $170,000 |
Source: Public Records
Tax History Compared to Growth
Tax History
| Year | Tax Paid | Tax Assessment Tax Assessment Total Assessment is a certain percentage of the fair market value that is determined by local assessors to be the total taxable value of land and additions on the property. | Land | Improvement |
|---|---|---|---|---|
| 2025 | $10,870 | $1,770,400 | $1,200,000 | $570,400 |
| 2024 | $10,870 | $1,770,400 | $1,200,000 | $570,400 |
| 2023 | $10,782 | $1,770,400 | $1,200,000 | $570,400 |
| 2022 | $10,056 | $1,770,400 | $1,200,000 | $570,400 |
| 2021 | $9,684 | $1,770,400 | $1,200,000 | $570,400 |
| 2020 | $9,312 | $1,770,400 | $1,200,000 | $570,400 |
| 2019 | $9,029 | $1,770,400 | $1,200,000 | $570,400 |
| 2018 | $8,640 | $1,770,400 | $1,200,000 | $570,400 |
| 2017 | $7,848 | $1,411,500 | $900,000 | $511,500 |
| 2016 | $7,763 | $1,411,500 | $900,000 | $511,500 |
| 2015 | $7,636 | $1,411,500 | $900,000 | $511,500 |
| 2014 | $7,552 | $1,411,500 | $900,000 | $511,500 |
Source: Public Records
Map
Nearby Homes