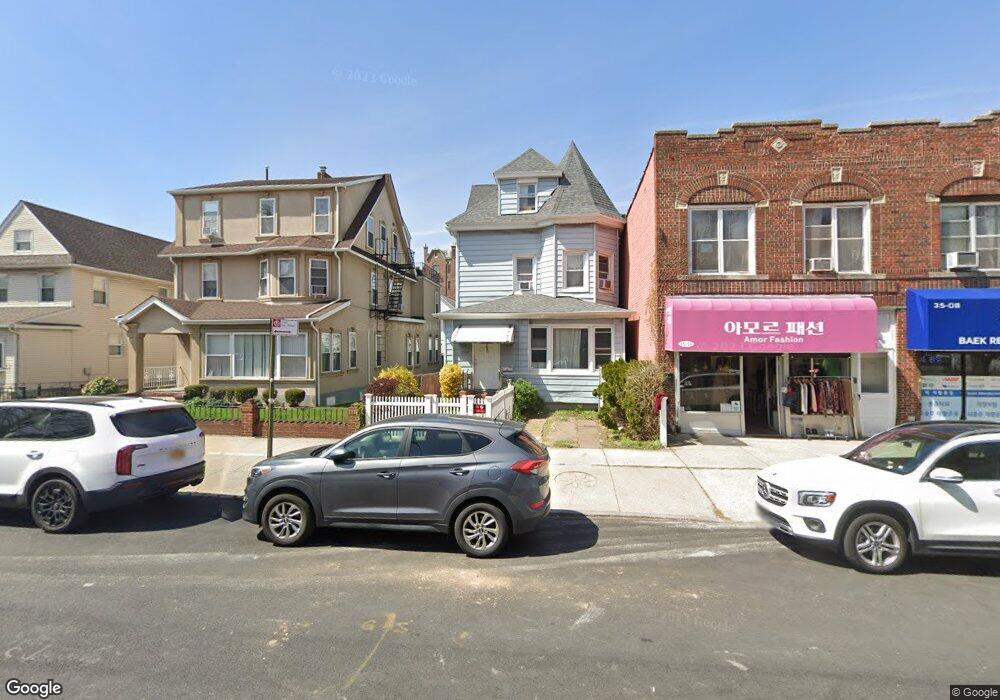
35-12 154th St Flushing, NY 11354
Flushing NeighborhoodEstimated Value: $885,000 - $1,261,000
4
Beds
2
Baths
1,520
Sq Ft
$693/Sq Ft
Est. Value
About This Home
This home is located at 35-12 154th St, Flushing, NY 11354 and is currently estimated at $1,053,688, approximately $693 per square foot. 35-12 154th St is a home located in Queens County with nearby schools including P.S. 21 Edward Hart, Jhs 185 Edward Bleeker, and Flushing High School.
Ownership History
Date
Name
Owned For
Owner Type
Purchase Details
Closed on
Apr 29, 2024
Sold by
Wu A A and Wu K
Bought by
Teng Min Qin and Wu Fengyong
Current Estimated Value
Home Financials for this Owner
Home Financials are based on the most recent Mortgage that was taken out on this home.
Original Mortgage
$500,000
Outstanding Balance
$492,868
Interest Rate
6.79%
Mortgage Type
Purchase Money Mortgage
Estimated Equity
$560,820
Purchase Details
Closed on
Jan 29, 2014
Sold by
Michael Lumley As Co-Trustee and The Elizabeth Lumley Irrevocable Trust
Bought by
Wu Feng Yong
Home Financials for this Owner
Home Financials are based on the most recent Mortgage that was taken out on this home.
Original Mortgage
$275,000
Interest Rate
4.47%
Mortgage Type
New Conventional
Purchase Details
Closed on
Sep 19, 2008
Sold by
Lumley Elizabeth
Bought by
Elizabeth Lumley Irrevocable Trust and Michael Lumley As Trustee
Create a Home Valuation Report for This Property
The Home Valuation Report is an in-depth analysis detailing your home's value as well as a comparison with similar homes in the area
Home Values in the Area
Average Home Value in this Area
Purchase History
| Date | Buyer | Sale Price | Title Company |
|---|---|---|---|
| Teng Min Qin | -- | -- | |
| Teng Min Qin | -- | -- | |
| Wu Feng Yong | $550,000 | -- | |
| Wu Feng Yong | $550,000 | -- | |
| Elizabeth Lumley Irrevocable Trust | -- | -- | |
| Elizabeth Lumley Irrevocable Trust | -- | -- |
Source: Public Records
Mortgage History
| Date | Status | Borrower | Loan Amount |
|---|---|---|---|
| Open | Teng Min Qin | $500,000 | |
| Closed | Teng Min Qin | $500,000 | |
| Closed | Wu Feng Yong | $275,000 |
Source: Public Records
Tax History Compared to Growth
Tax History
| Year | Tax Paid | Tax Assessment Tax Assessment Total Assessment is a certain percentage of the fair market value that is determined by local assessors to be the total taxable value of land and additions on the property. | Land | Improvement |
|---|---|---|---|---|
| 2025 | $6,318 | $36,116 | $10,884 | $25,232 |
| 2024 | $6,422 | $35,254 | $10,008 | $25,246 |
| 2023 | $5,972 | $33,534 | $8,034 | $25,500 |
| 2022 | $5,692 | $55,080 | $15,840 | $39,240 |
| 2021 | $5,675 | $55,680 | $15,840 | $39,840 |
| 2020 | $5,712 | $52,200 | $15,840 | $36,360 |
| 2019 | $5,487 | $55,320 | $15,840 | $39,480 |
| 2018 | $5,038 | $27,945 | $6,844 | $21,101 |
| 2017 | $4,758 | $26,512 | $8,905 | $17,607 |
| 2016 | $4,393 | $26,512 | $8,905 | $17,607 |
| 2015 | $2,578 | $25,081 | $10,321 | $14,760 |
| 2014 | $2,578 | $24,482 | $12,096 | $12,386 |
Source: Public Records
Map
Nearby Homes
- 34-15 153rd St
- 3419 Murray St
- 39-25 Murray St
- 33-38 153rd St
- 3425 150th Place Unit 6E
- 33-06 154th St
- 34-25 150th Place Unit 2C
- 40-11 157th St
- 33-47 158th St
- 152-18 33rd Ave
- 151-14 33rd Ave
- 151-10 33rd Ave
- 3225 155th St
- 3323 158th St
- 40-25 158th St
- 35-10 150th St Unit 4
- 14943 35th Ave Unit 5K
- 149-43 35 Ave Unit 3J
- 155-17 Sanford Ave Unit 2
- 155-17 Sanford Ave Unit 2F
- 35-04 154th St Unit 2nd Fl
- 35-04 154th St
- 3504 154th St
- 3504 154th St
- 3502 154th St
- 3506 154th St
- 3508 154th St
- 3508 154th St Unit 1fl
- 3508 154th St
- 35-08 154th St
- 3510 154th St
- 35-10 154th St
- 15310 35th Ave
- 3512 154th St
- 15402 35th Ave
- 154-02 35th Ave
- 15308 35th Ave
- 3516 154th St
- 15317 35th Ave Unit 2
- 15311 35th Ave